

ValuEngine Forecast: Large Cap Growth to Outperform
2021-10-13
Market Forecasts for 4th Quarter 2021 and Beyond
The ETF reports on ValuEngine for funds that follow market benchmarks provide a side benefit in writing market analyses. They are a window to the implicit forecasts for 1-, 3-, 6- and 12-month forecasts VE models are making for each benchmark’s ETF portfolio. This is because the ratings and projections combine bottom-up constituent analysis with analyses of the historical price movements of the ETF in different market environments.
The benchmark indexes chosen for this feature are:
- The S&P 400 MidCap Index representing US MidCap (MDY)
- The Russell 2000 Index representing US Small Cap (IWM)
- The Russell 1000 Large Cap Growth Index (IWF)
- The Russell 1000 Large Cap Value Index (IWD)
- The Nasdaq-100, constructed as an index using the top 100 non-financial stocks with primary listing on the Nasdaq, but now regarded as the premier US Big Tech Index (QQQ)
- The S&P 500 Index representing US Large Cap (IVV)
This summary table contains all five indexes and ETFs that hold them. It also includes historical, valuation and informational data for reference. Today’s focus is on the remainder of 2021, the 3-month forecast and the 12-month period ending September 30. 2022. On the chart, this is listed as the ValuEngine forecast for 1-year indicating the next 12 months.
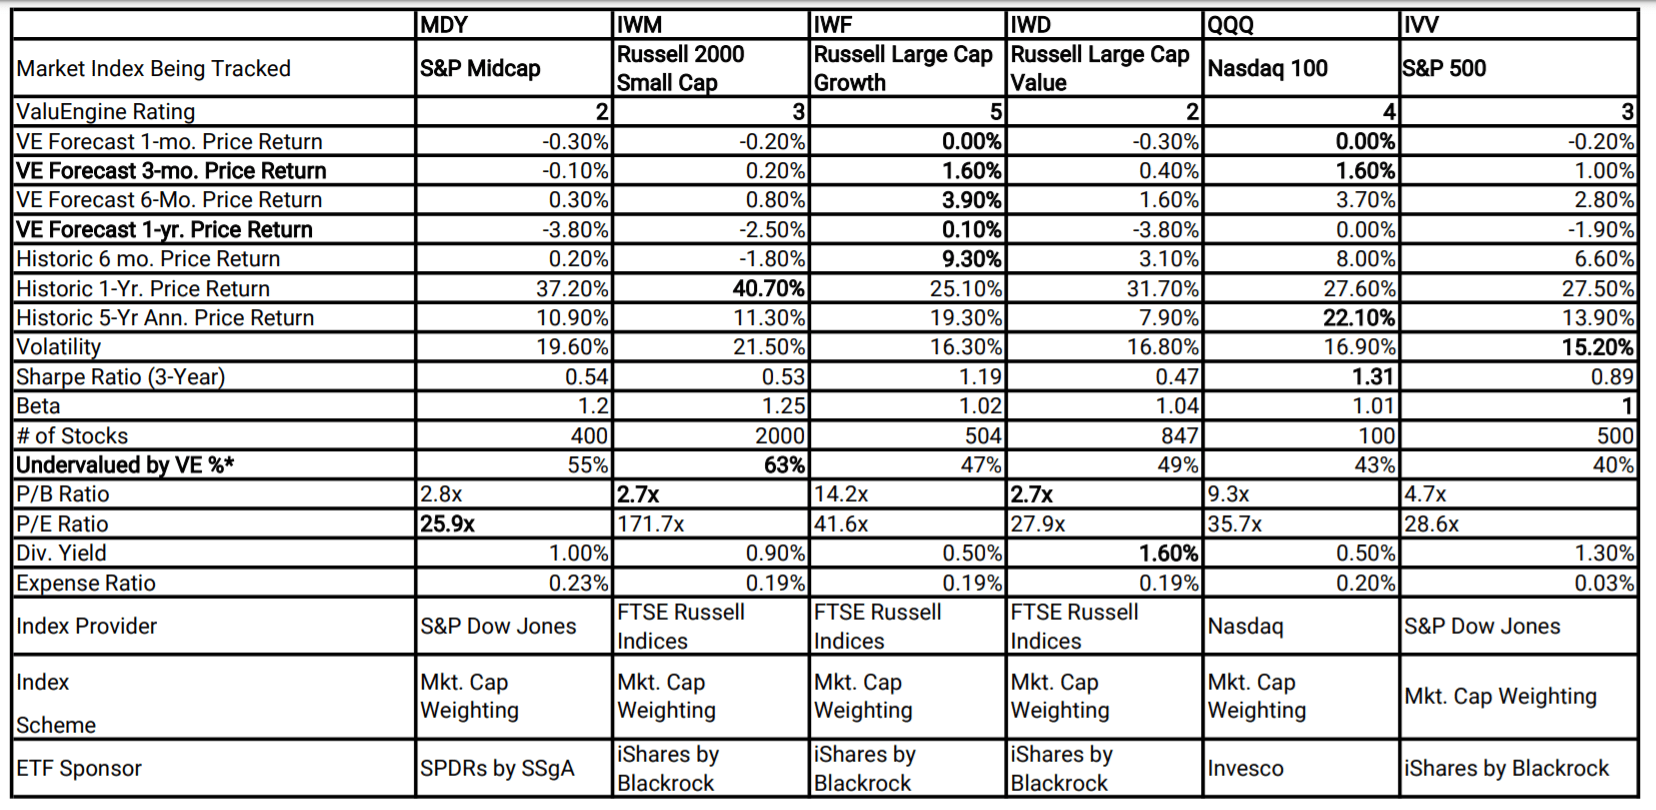
In order to frame our forecasts, let’s look at the ValuEngine ranks summarizing our models’ views on the expected price appreciation of IVV, an ETF built to replicate performance of the S&P 500 Index. This is the most common benchmark for active management and the focus of most market forecasts. IVV has a rating of 3 thus predicting average performance among the ETFs in our universe during the next six months. Given its bellwether status as the market’s proxy, a rating of 3 is the norm for IVV. The ValuEngine market forecasts for IVV – and thus the S&P 500 – will vary from negative to positive depending on our models’ assessments of the current environment.
Focusing on the S&P 500 column in the four rows containing our forecasts, our models expect the market to navigate choppily from a mildly down month of October to a decent run between November and March, ending the 4th quarter up a bit and continuing to rise modestly in January through March of 2022. So, the forecast for the next six months is positive with a projected gain of nearly 3%. However, with a 12-month forecast of -2%, even after that 3% gain, our models generally indicate a continuation of the back-and-forth.
Are there segments of the market for which the ValuEngine models have a more positive outlook? Yes, but the results may be surprising. Many major strategists have been very vocal about their expectations that value will outperform growth for the rest of this year and the following 12 months. One particularly iconic one predicted that small- and mid-cap will significantly outperform large cap.
Our forecasts strongly disagree. IWD is a sizable ETF based upon Large Cap Value Index components determined by value factors such as book-to-price; dividend yield; payout ratio; and earnings-to-price ratio. This ETF has a 2 rating, predicting underperformance. Looking down the ETF’s column in the table, IWD has the worst 1-month, 3-month, 6-month and year-ahead projections in the table.
The forecasts for the Midcap ETF, MDY, are very similar. IWM, the Russell 2000 Index most often used as the proxy for small cap stocks, is rated to perform a bit closer in line with the market with a 3 rating. The 1-year forecast for IWM is -2.5%, not great but more in line with the S&P 500 forecast of -1.9% than the forecast for IWD and MDY which are both close to -4%.
For value and non-mega-stock enthusiasts, I will point out that on a traditional valuation basis, ValuEngine agrees that many of the stocks in these segments are undervalued. We currently rate 63% of small cap stocks in IWM and 55% of the midcap stocks in MDY as undervalued. This compares with just 40% of stocks in IVV rated as undervalued. Moreover, as selection sets for active managers, both MDY and IWM have plenty of stocks that may be timely now. Examples in IWM Include 4-rated AMC Entertainment (AMC) and Intella Theraputics (NTLA). A midcap stock in MDY we like is 4-rated SolarEdge Tech. (SEDG). Finally, both MDY and IWM have Price/Book valuations considerably lower than IVV.
Last week’s blog referenced our continued positive outlook for large-cap technology stock index ETFs as represented by QQQ and XLK, the Select Sector Technology SPDR. Both still have above average ratings of 4. QQQ has a 3-month forecast of +1.5% and a 6-month forecast of 3.7% both higher than the forecasts for S&P 500-based IVV.
There is one segment-defining ETF that rates even higher. That is IWF, representing the Large Cap Growth as measure by the Russell 1000 Growth Index. IWF is rated 5, in the top tier for projected performance in the next six-to-twelve months. The underlying index selects components based on three fundamental factors: EPS Growth; Return on Equity and Dividend Growth and currently has just over 500 components. With a 51% weighting in technology stocks, IWF is even more tech-heavy than IVV (39%) but less so than QQQ (60%). Interestingly, IVV is the only ETF we measure that has experienced less recent price volatility than IWF.
Strategists correctly point out the risks inherent in buying growth stocks with the market at all-time highs and record valuations on most traditional ratios. Yet, no one knows when that inflection point will be. Our models indicate that for IWF and large cap tech stocks, that correction may still be one year away.
Social Share:
Topic Tags:
Contribute Your Research

Signals
to reach a global audience of hedge funds, mutual funds, wealth managers and ETF sponsors