

Dividend ETFs By Any Other Name
2021-12-22
Their top pick at the time was SCHD, the Schwab US Dividend ETF despite the fact that SDOG, the ALPS Sector Dividend Dogs, had a higher dividend, 3.5% as compared with 3.0%.
That said, there are investors who have reached a point in their lives where they are no longer interested in capital appreciation and are focused only on income. This column is intended for them because there are, in fact, ETFs that provide more income than any ETF with the word dividend in the title.
Here are a few examples and their dividend yields:
QYLD, Global-X Nasdaq-100 Covered Call ETF, 11.3%
BIZD, Van Eck BDC Income ETF, 7.9%
PCEF, Invesco Income Composite ETF, 6.8%
KBWY, Invesco Premium Yield Equity REIT ETF, 5.6%
In comparison, the highest current yield we could find in an ETF including the word “Dividend” is:
- DIV, Global-X Super Dividend ETF, 5.4%
All four ETFs derive these extraordinary yields in unconventional ways.
QYLD matches QQQ’s Nasdaq-100 stock exposures but earns income by selling NDX index call options and passes it on to investors net of fees.
BIZD tracks a concentrated index of US publicly-listed private equity investment companies known as Business Development Companies or BDCs. The ETF buys shares of firms that in turn invest in the debt and equity of mid-sized private firms.
PCEF is invested in three types of yield-focused closed-end funds: investment-grade fixed-income, high-yield fixed-income, and option-writing.
KBWY uses an algorithm that selects mostly commercial and small cap REITs (Real Estate Investment Trusts), then weights these holdings by dividend yield.
If the 5.4% dividend yield of DIV can be considered Super-high, then these ETFs can only be considered Ultra-high as in the Latin Phrase non plus ultra (“none higher”).
This table compares what tradeoffs investors must take, if any, total return or volatility in order to earn an income stream higher than core dividend ETFs. We include VOO, the Vanguard S&P 500 ETF for comparative purposes. Positive outliers in each category are bolded in black. Negative outliers appear in red.
Comparison Table as of Dec. 17, 2021
|
ETF |
Dividend Yield % | 1-Yr. Tot. Return | 5-Yr. Tot. Return |
Volatility (Standard Deviation) |
Approx. Sharpe (5-Yr. Ret. / Std. Dev.) | Total Expense Ratio |
| QYLD | 11.% | 11.9% | 11.2% | 13.9 | 0.81 | 0.60% |
| BIZD | 8.3% | 32.8% | 9.1% | 32.5 | 0.28 | 10.07%* |
| PCEF | 6.8% | 17.5% | 9.5% | 16.3 | 0.58 | 2.34%* |
| KBWY | 5.6% | 21.4% | 1.9% | 32.7 | 0.06 | 0.35% |
| DIV | 5.4% | 23.5% | 2.8% | 28.1 | 0.10 | 0.45% |
| SDOG | 3.5% | 19.8% | 7.5% | 23.2 | 0.32 | 0.40% |
| SCHD | 2.9% | 24.7% | 15.6% | 18.7 | 0.83 | 0.06% |
| VOO | 1.2% | 29.2% | 17.9% | 18.5 | 0.97 | 0.03% |
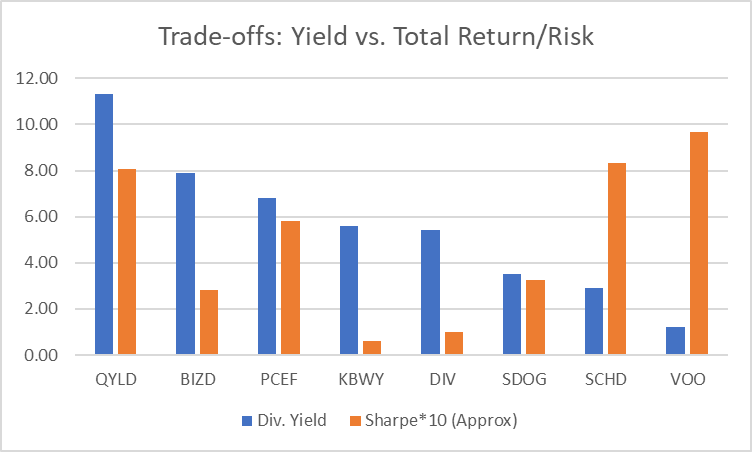
The top line reveals some very attractive features for QYLD. Not only does it have the top dividend yield by a wide margin but it has the least volatility. Its approximated Sharpe Ratio comparing total return to risk is very similar to SCHD, the ETF we recommended last week for some substitute core allocation for investors needing more income than VOO provides.
The graph below illustrates the risk-return tradeoff of the 8 ETFs included in the analysis. For visual comparative purposes, we multiplied yield by 100 and the Sharpe Ratio by 10.
Key Findings:
- During the past five years. VOO, based on buying and holding the S&P 500 has been the best growth vehicle but its paltry 1.3% dividend yield makes it unsuitable for income-oriented investors. It also has the lowest expense ratio. Readers of this blog know that most investors should buy new shares of Vanguard’s VOO or IVV from iShares in lieu of SPY for two-reasons: a six-basis-point lower fee combined with a more efficient structure that can reinvest dividends and lend its stocks.
- SCHD provides an attractive alternative to VOO for income and growth investors with comparable growth and an income stream comparable to the ten-year US Treasury bill. It is also cost-efficient with the lowest expense ratio available for an ETF with a dividend tilt. In fact, SCHD also has a lower expense ratio than SPY. Readers of this blog know that most investors should buy new shares of Vanguard’s VOO or IVV for two-reasons: a six-basis-point lower fee combined with a more efficient structure that can reinvest dividends and lend its stocks.
- Although the valuations are not shown on the prior table, SDOG has the best valuation metrics of the ETFs reviewed here and a more attractive yield for an income and growth investor. Its volatility is higher but within acceptable ranges. Its diversified security selection consisting only of five S&P 500 holdings from each S&P sector gives it less concentration risk than DIV, KBWY and BIZD as we will see shortly. However, those three ETFs do also supply considerably higher dividend yields. So, if income is actually your only objective, SDOG will not provide nearly as good an income stream. The expense ratio of 0.40% is also much higher than SCHD and on the high end for other ETFs that combine mainstream holdings with dividend tilts.
- DIV, from the Global X family of thematic ETFs, delivers a much higher yield than SCHD, 5.4% as compared with 2.9%. Otherwise SCHD and SDOG are both superior in every way. DIV is less diversified, more volatile, has historically provided lower total returns and has a higher+ expense ratio at 0.45%. Therefore, with a ValuEngine rating of 1 (strong sell), DIV is not relatively attractive to income and growth investors. Moreover, since there are four more ETFs here with considerably higher yields, income-focused investors also have better choices available to them than DIV.
- KBWY, Invesco KBW Premium Yield Equity REIT ETF, is another ETF with little to recommend beyond its 5.6% dividend yield although the fact that it pays out its income on a monthly basis may interest some. KBWY is highly volatile, has posted lower total returns than most of its REIT ETF peers and considerably lower than SCHD. Its dividend-yield weighting scheme produces its superior income stream but also contributes to volatility and low quality ratings. REIT ETFs are frequently mentioned as alternative income sources. However, even if income is the only consideration, three better alternatives follow.
- PCEF, Invesco’s CEF Income Composite ETF, is a very interesting alternative for income and growth investors and income-only investors. Its 6.9% yield combines with lower volatility than VOO and all but one of the ETFs we will review today. It is also well diversified with more than 100 holdings and a number of quality screens integrated into the algorithmic index developed by Alerian S-Network with input from closed-end fund experts. It provides about half as much growth as VOO but has the fourth-best sharp ratio of this group because of its low volatility. The only daunting statistic in our analytic chart is the 2.34% expense ratio. However, the management fee is 0.50% as the 2.34% includes the implicit fees already reflected in the prices of the underlying closed end funds. Nevertheless, PCEF is a fine choice for dividend-first investors also looking for some capital growth.
- BIZD, the Van Eck BDC Income ETF provides a dividend yield of 8.3%. This, in itself, should put it in the potential selections set of Income-first and income-only investors. Additionally, BIZD has good momentum with the highest one-year total return of any ETF in our table. The downsides are very volatile returns, lack of diversification and a shocking expense ratio of more than 10% derived primarily from the acquired fund fees of its underlying BDCs because Van Eck’s management fee is just 0,40%, competitive for specialty asset class ETFs. One caveat is that BDCs are pass-through securities with income that can be taxed at a higher rate than ordinary dividends. Investors are cautioned to check this aspect out before buying.
- QYLD, Global X NASDAQ 100 Covered Call ETF (QYLD) has been called a hidden gem on Seeking Alpha and TalkMarkets by a number of blog columnists. I concur. Its yield of 11.5% is tremendously attractive for income-first and income-only investors. Its volatility is the lowest in the table with a highly competitive Sharpe Ratio. The ETF seeks to provide investment results that closely correspond, before fees and expenses, generally to the price and yield performance of the CBOE NASDAQ-100® BuyWrite V2 Index The CBOE NASDAQ-100® BuyWrite Index is a benchmark index that measures the performance of a theoretical portfolio that holds a portfolio of the stocks included in the NASDAQ-100® Index, also the basis for QQQ, and “writes” (or sells) a succession of one-month at-the-money NASDAQ-100® Index covered call options. QYLD has an expense ratio of 0.60%, which is 21% lower than its category. The same caveat applies as with BIZD, Have your tax professional check out the implication for the after-tax income your account will receive. As I always warn, read and understand the fact sheet and Summary Prospectus before buying any ETF. The devils are in the details.
Blank’s recommendation at this time is QYLD to dividend-first equity investors. Its 11.5% yield and persistent stability makes it ideal for income-first and income-only investors. If income is your king, QYLD should make the perfect queen.
Social Share:
Topic Tags:
Contribute Your Research

Signals
to reach a global audience of hedge funds, mutual funds, wealth managers and ETF sponsors