March 1, 2022 by Herb Blank
The trend is your friend. That is, until it isn’t.
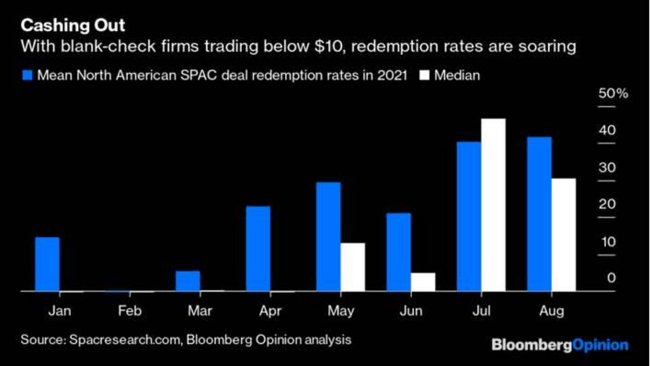
The list of best performing non-leveraged ETFs for the past 90-days is led almost exclusively by ETFs that hold the stocks of fossil-fuel-based energy and closely related companies. At the same time, the prices of ESG and more climate-focused impact ETFs have plunged dramatically. With close eyes on the ever-worsening conflict in the Ukraine and its projected effects on oil prices and inflation, few experts are expecting a reversal to come in the next six months. However, there are some contrarians that do see a reversal on the horizon. This week we look at Impact ETFs with an emphasis on environmentally focused ETFs.
The SustainFi.com website maintains a helpful list of the mind-boggling number of ETFs designed for ESG and Impact investors. Even more helpful, it follows a taxonomy that allows readers to zero in on the ETFs that fall into the classification that most interests them. This article only includes ETFs that contain mostly US Stocks.
The first grouping contains the names and tickers of 21 broad-based ESG funds and is listed below. Broad-based ESG ETFs generally utilize best-of-industry scores in Environmental, Social and Governance rankings in their methodologies to eliminate poor scorers, generally by at least 50% in each industry. There are nuances separating each. For example, iShares by BlackRock and MSCI have created three different levels of screened ETFs with ESGU screening out the bottom 50% of ESG scorers in each industry group; SUSA eliminates all carbon-based and other exposures from ESGU and SUSL focuses on the top 25% of performers in SUSA.
Indexes, targeted segments such as cap size, and value/growth are available. What most of these have in common is that they are created primarily for risk control. Many studies during the last ten years have confirmed that companies that score below average on ESG have more risk of future reputation-damaging events that affect revenues and stock performance. Indeed, most of the funds listed here have outperformed their selected benchmarks over the last 5 years, generally with slightly better Sortino Ratios (a measure similar to Sharpe ratio but looking only at downside deviations). This makes them solid core investments and very suitable for the needs of institutional investors. ESGU with more than 20 billion dollars under management and AAA (highest) ESG rating from MSCI is a solid institutional choice.
Broad-Based ESG-Screened Funds (22)
FlexShares STOXX US ESG Select Index Fund (ESG)
iShares ESG Aware MSCI USA ETF (ESGU)
iShares ESG MSCI USA Leaders ETF (SUSL)
iShares MSCI USA ESG Select ETF (SUSA)
Vanguard ESG U.S. Stock ETF (ESGV)
Xtrackers MSCI USA ESG Leaders Equity ETF (USSG)
iShares MSCI KLD 400 Social ETF (DSI)
Nuveen ESG Large-Cap Value ETF (NULV)
Nuveen ESG Small-Cap ETF (NUSC)
iShares ESG Aware MSCI USA Small-Cap ETF (ESML)
Nuveen ESG Large-Cap Growth ETF (NULG)
Xtrackers S&P 500 ESG ETF (SNPE)
IQ Candriam ESG US Equity ETF (IQSU)
Nuveen ESG Mid-Cap Growth ETF (NUMG)
Nuveen ESG Mid-Cap Value ETF (NUMV)
SPDR S&P 500 ESG ETF (EFIV)
iShares ESG Advanced MSCI USA ETF (USXF)
ClearBridge Large Cap Growth ESG ETF (LRGE)
Nuveen ESG Large-Cap ETF (NULC)
WisdomTree U.S. ESG Fund (RESP)
Nuveen Winslow Large-Cap Growth ESG ETF (NWLG)
Hartford Schroders ESG US Equity ETF (HEET)
As Todd Rosenbluth of CFRA wrote for an article printed in Barron’s in January, 7 of 10 funds fitting the large-cap or total market categories outperformed the S&P 500 in 2021. My research using ValuEngine data shows that most of these also outperformed the S&P 500 over the five-year period ending December 31, 2021. This is noteworthy since the majority of ETFs and a larger majority of mutual funds did not do so. As many others have documented, we now have enough data to conclude that empirically, the outdated belief that funds that take social responsibility criteria into account must sacrifice performance is dead.
Most institutional portfolio management teams now consider ESG pillar data to be risk factors. From a valuation perspective, they are calculable “intangibles” that should be accounted for on a modernized balance sheet. We are quickly getting to a time where asset managers not doing so risk being criticized for not following best practices. Therefore, ESG ETFs are simply more prudent core investment allocations than traditional ETFs. For these reasons, most taxonomies of responsible investing in today’s world make a distinction between ESG investing, also called ESG-Aware investing, and Impact Investing. Somewhere between the two lies Fossil-Fuel-Free Investing
Most of the constituents of Fossil Free funds are similar. However, the resultant industry sector “bets” will create cyclical outperformance and underperformance that may be considered suboptimal for institutional investors focused on benchmark tracking.
Broad-based ESG ETFs are not, however, the most targeted options for investors that truly wish to align their investment dollars with their personal convictions. ESGU, for example, will contain high-carbon companies such as ExxonMobil and other companies with business practices many investors may find abhorrent for diverse reasons. An individual or group looking for value alignment however is unlikely to be satisfied with ESGU because they still own too many companies engaged in activities inconsistent with ESG objectives.
Let’s take a look at more targeted categories of impact ETFs.
TrueShares ESG Active Opportunities ETF (ECOZ)
American Century Sustainable Equity ETF (ESGA)
Stance Equity Large Cap Core ETF (STNC)
Fidelity Sustainability U.S. Equity ETF (FSST)
Goldman Sachs Future Planet Equity ETF (GSFP)
Trend Aggregation ESG ETF (TEGS)
VictoryShares THB Mid Cap ESG ETF (MDCP)
- Low-Carbon and Climate Transition (6)
BlackRock U.S. Carbon Transition Readiness ETF (LCTU)
iShares MSCI ACWI Low Carbon Target ETF (CRBN)
Invesco MSCI Sustainable Future ETF (ERTH)
SPDR MSCI ACWI Low Carbon Target ETF (LOWC)
BlackRock World ex U.S. Carbon Transition Readiness ETF (LCTD)
JPMorgan Carbon Transition US Equity ETF (JCTR)
iClima Global Decarbonization Transition Leaders ETF (CLMA)
- Clean Energy, Smart Grid, and Cleantech (23)
First Trust NASDAQ Clean Edge Green Energy Index Fund (QCLN)
Invesco WilderHill Clean Energy ETF (PBW)
ALPS Clean Energy ETF (ACES)
iShares Global Clean Energy ETF (ICLN)
First Trust NASDAQ Clean Edge Smart Grid Infrastructure Index Fund (GRID)
Invesco Solar ETF (TAN)
Global X Solar ETF (RAYS)
Invesco MSCI Sustainable Future ETF (ERTH)
First Trust Global Wind Energy ETF (FAN)
Global X Wind Energy ETF (WNDY)
Invesco Global Clean Energy ETF (PBD)
SPDR Kensho Clean Power ETF (CNRG)
VanEck Vectors Low Carbon Energy ETF (SMOG)
Global X CleanTech ETF (CTEC)
Global X Renewable Energy Producers ETF (RNRG)
Defiance Next Gen H2 ETF (HDRO)
Direxion Hydrogen ETF (HJEN)
Global X Hydrogen ETF (HYDR)
SPDR S&P Kensho Intelligent Structures ETF (SIMS)
Virtus Duff & Phelps Clean Energy ETF (VCLN)
BlackRock Future Climate and Sustainable Economy ETF (BECO)
iClima Distributed Renewable Energy Transition Leaders ETF (SHFT)
VanEck Green Metals ETF (GMET)
Invesco Water Resources ETF (PHO)
Invesco Global Water ETF (PIO)
Ecofin Global Water ESG Fund (EBLU)
Invesco S&P Global Water Index ETF (CGW)
First Trust Water ETF (FIW)
Global X Clean Water ETF (AQWA)
Although actively managed Climate-focused mutual funds have been around for more than a decade, active ETFs are relatively new entrants in this category. They are a welcome addition because separating ESG data noise from signal is still being intensely debated in the ESG community. Additionally, most ESG data is more than one year old when finally published.
In a recent ETF.com article, author Jessica Ferringer noted wryly that the FlexShares STOXX US ESG Impact Index Fund with ESG as the ticker symbol itself had an MSCI Sustainability Rating of just 7.6 as compared with 7.8 for SPY, probably not what ESG investors expected. A number of other index products also had ratings barely differentiable in sustainability from SPY. Ms. Ferringer then mused on whether this was an area better served by active management.
For this analysis, we selected three actively managed funds that bolster the point, ECOZ, ESGU and LCTU. The other five funds are index-funds that follow specific algorithms to select impact stocks in alignment with UN-defined Sustainable Development Goals (SDGs). These ETFs include fossil-free broad-based ETHO, clean energy technology tech funds QCLN and PBW and clean water fund PHO. All eight of these ETFs are covered in ValuEngine ETF Reports
Brief descriptions:
ECOZ, TrueShares ESG Active Opportunities ETF is actively managed to invest in US large-cap stocks selected using a two-phase process. In the initial phase, fund advisors use their own analysis of quantitative data focused on carbon emissions combined with third-party scores to evaluate ESG characteristics and relative scoring. In the second phase, additional fundamental analytics are applied to determine each stock’s relative value. Stocks are then ranked by ESG and relative value within their respective industries, with roughly 75-125 being selected for the investment portfolio.
ESGA, American Century Sustainable Equity ETF – This is one of the first ETFs to use the nontransparent, NYSE Proxy Portfolio structure which discloses holdings only on a quarterly basis with a 15-day lag. The fund actively selects US large-caps using its own quantitative model to score stocks based on their value and growth potential with an overlay of ESG metrics, with the end goal of identifying most attractive ESG stocks. Each stock’s final composite score is evaluated on a sector-specific basis, meaning those with the strongest score in their respective sector are considered for the portfolio.
LCTU, BlackRock U.S. Carbon Transition Readiness ETF is an actively-managed portfolio of large- and mid-cap US firms in the Russell 1000 Index that are selected and weighted with a preference for lower carbon emissions. LCTU uses proprietary scoring criteria to assess the readiness of companies for a low-carbon economy transition, relative to their industry peers. The ‘transition readiness’ score includes five segments: Fossil Fuels, Clean Technology, Energy Management, Waste Management and Water Management. LCTU overweights high-scoring firms while mitigating risk. In addition to this strategy, firms may also be evaluated for good governance.
ETHO, ETHO Climate Leadership ETF – tracks the performance of an equal-weighted index that selects US stocks that exhibit the least carbon impact within its industry. Each company is measured according to their climate impact, which is calculated based on total greenhouse gas emissions from operations, fuel use, supply chain, and business activities, divided by market capitalization. The top scoring half in each industry is selected, while simultaneously excluding all companies in energy, tobacco, aerospace and defense, gambling, gold, and silver sub-industries.
QCLN, First Trust NASDAQ Clean Edge Green Energy Index Fund – QCLN holds a broad cap-weighted portfolio of US-listed firms in the clean energy industry. Eligible companies must be manufacturers, developers, distributors, or installers of one of the following four sub-sectors: advanced materials (that enable clean-energy or reduce the need for petroleum products), energy intelligence (smart grid), energy storage and conversion (hybrid batteries), or renewable electricity generation (solar, wind, geothermal, etc). Because there is subjectivity in classifying companies as “clean energy”, potential investors would be well-served by reviewing the fund’s portfolio to make sure your definition of “clean energy” matches QCLN’s.
PBW, Invesco WilderHill Clean Energy ETF – PBW tracks a modified equal-weighted index of companies involved in cleaner energy sources or energy conservation. It is highly diverse in scope, reaching beyond just industry pure-plays like wind, solar, biofuels and geothermal companies, to include companies based on their perceived relevance to the renewable energy space. The fund’s proprietary selection process and its mandate are to hold only select US-listed companies that are perceived to benefit from the societal transition or advancement toward clean energy and conservation.
PHO, Invesco Water Resources ETF – PHO is a water-themed fund of US companies that create products that conserve and purify water for homes, businesses, and industries. Securities also participate in the Green Economy, as determined by SustainableBusiness.com LLC. Holdings are weighted by liquidity, with no more than five companies capped at 8% and with the rest distributed equally. The index is reconstituted annually in April and rebalanced quarterly
ESG, FlexShares STOXX Select ESG ETF – follows a principles-based index composed of US-listed companies that exhibit environmental, social, and corporate governance (ESG) characteristics. Until recently, the fund was named FlexShares STOXX US ESG Impact Index Fund. STOXX is a Switzerland based index provider that launched as a pioneer in sustainable indexing more than 20 years ago. Selection factors are aligned with UN Sustainable Development Goals (SDGs). They include: low emissions; board governance and inclusion criteria; policies against child labor, and non-use of golden parachute agreements. Disqualifying characteristics include non-adherence to UN Global compact principles, involvement in controversial weapons, or coal mining. All qualifying constituents are weighted based on an aggregated “ESG score” derived from the factors mentioned above.
The following chart compares pertinent factors. A few of these factors including MSCI ESG Score, Start Date, P/B ratio, P/E Ratio and Expense Ratio came from ETF.com. The MSCI ESG Fund Rating measures the resiliency of portfolios to long-term risks and opportunities arising from environmental, social, and governance factors. The rest of the data came from the ValuEngine reports.
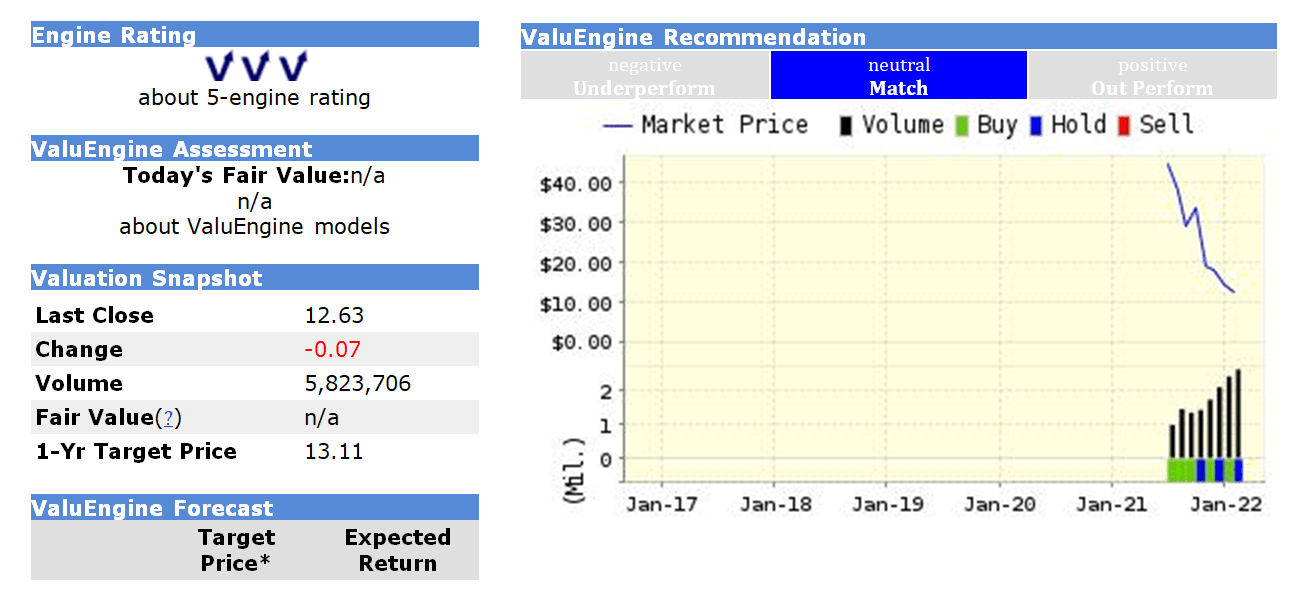
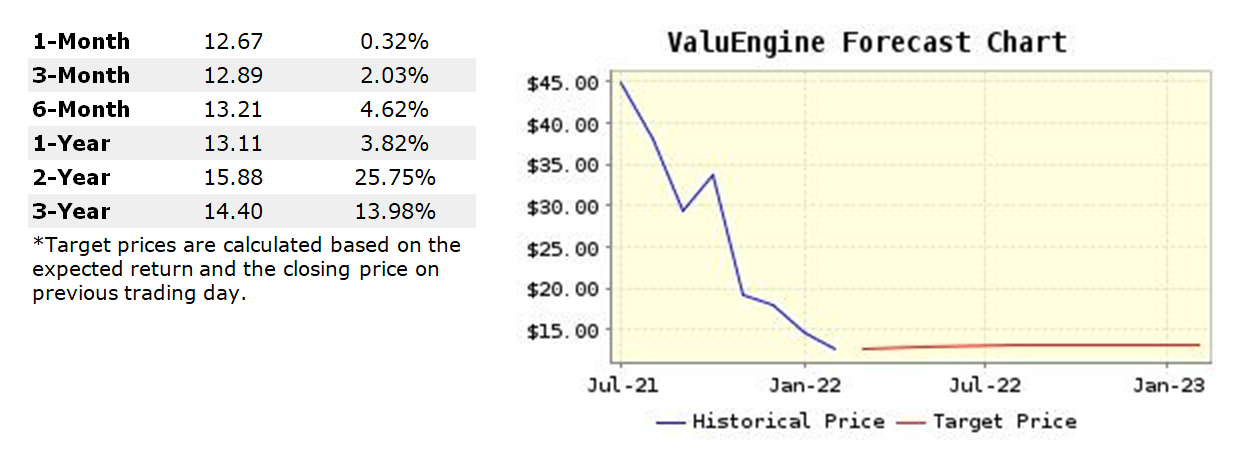
Current ValuEngine reports on these ETF’s can be viewed HERE
|
ECOZ |
ESGA |
LCTU |
ETHO |
QCLN |
PBW |
PHO |
ESG |
| ValuEngine Rating |
4 |
5 |
3 |
4 |
5 |
5 |
5 |
3 |
| MSCI ESG Score |
8.6 |
8.2 |
7.9 |
7.4 |
7.0 |
6.7 |
10.0 |
7.6 |
| Start Date |
Feb-20 |
Jul-20 |
Apr-21 |
Nov-15 |
Feb-07 |
Mar-05 |
Dec-05 |
Jul-16 |
| VE Forecast 6-mo. Price Change |
+2.7% |
+2.7% |
+2.0% |
+2.0% |
+3.7% |
+5.2% |
+3.1% |
+2.1% |
| VE Forecast 1-yr. Price Change |
-1.1% |
+1.1% |
-1.9% |
-1.1% |
+3.3% |
+4.7% |
+0.1% |
-1.8% |
| Historic 1 mo. Price Change |
-5.5% |
-4.7% |
-5.4% |
-5.3% |
-12.7% |
-10.9% |
-5.7% |
-5.8% |
| Historic 3 mo. Price Change |
-14.3% |
-9.4% |
-9.9% |
-13.4% |
-30.4% |
-38.2% |
-14.1% |
–8.8% |
| Historic 1-Yr. Pr. Change |
-1.9% |
10.8% |
N/A |
-0.7% |
-35.1% |
-52.9% |
6.0% |
9.8% |
| Historic 5-Yr Ann. Pr. ChangePrice |
N/A |
N/A |
N/A |
14.3% |
25.7% |
22.0% |
14.8% |
14.5% |
| Volatility |
18.2% |
12.2% |
13.8% |
17.5% |
32.3% |
37.6% |
17.8% |
16.0% |
| Sharpe Ratio |
N/A |
1.3* provisional |
N/A |
0.8 |
0.8 |
0.6 |
0.9 |
0.9 |
| Beta |
1.06 |
1.07 |
0.98 |
1.07 |
1.45 |
1.50 |
0.95 |
1.00 |
| # of Stocks |
61 |
38 |
331 |
264 |
62 |
79 |
38 |
273 |
| Undervalued by VE % |
55% |
66% |
52% |
56% |
63% |
79% |
38% |
46% |
| P/B Ratio |
7.5 |
N/A |
4.7 |
4.0 |
4.9 |
4.9 |
5.1 |
5.0 |
| P/E Ratio |
34.6 |
N/A |
28.2 |
30.8 |
-73.1 |
-10.4 |
36.1 |
26.3 |
| Div. Yield |
0.5% |
0.8% |
2.4% |
0.8% |
0.0% |
2.2% |
0.2% |
1.1% |
| Expense Ratio |
0.58% |
0.39% |
0.14% |
0.48% |
0.60% |
0.61% |
0.60% |
0.32% |
| Active or Indexed |
Active |
Active |
Active |
Indexed |
Indexed |
Indexed |
Indexed |
Indexed |
| ETF Sponsor/ Advisor if not the sponsor |
True Shares/ Purview Investments |
American Century |
BlackRock
(NOT iShares) |
ETHO Capital |
First Trust |
INVESCO |
NVESCO |
FlexShares/Northern Trust |
Key Findings:
- Six of the eight ETFs are rated by our ValuEngine models to outperform for the next 6-month and year-ahead periods. We think investments in all six of these ETFs are very timely right now. The funds with our top rating of 5 include: ESGA, PBW, PHO and QCLN.
- In descending order, the four ETFs top-rated for overall ESG performance by MSCI are: PHO, ECOZ, ESGA and LCTU. In keeping with the earlier ETF.com reporter’s observation, three of the four are actively managed with only the indexed clean water ETF topping the more sector-diversified actively managed funds. Even though all three are listed as ESG funds taking all the SDGs into account, all three also qualify as environmental impact funds.
- The three actively managed ETFs all have less than three years of actual history and only ECOZ has two years under its belt. Still, the best performer for the last 12-months and 1 month, ESGA, is in the actively managed category with nearly a 10.9% 12-month return while the majority of the others had negative returns. ESG had the least negative return over the past three months and placed second for the past 12 months.
- For long-term performance, the best ETFs were the clean energy ETFs despite the carnage they endured in the past year. 5-year rates of return for QCLN and PBW respectively were 25.7% and 22% respectively as compared with 13.6% for SPY, the SPDR S&P 500 Index ETF. On the risk side, they have by far the two highest annual price volatility records of this group at greater than 30% per annum.
- The two INVESCO indexed clean environmental ETFs, PBW and PHO both with top VE ratings, are the two oldest ETFs in the study. This is because they acquired a company called PowerShares that was a true innovator in providing and promoting ETFs fitting this category. Fittingly, PowerShares Founders Bruce Bond and John Southard now head a provider called Innovator ETFs.
- Surprisingly, the lowest expense ratio in this sample set belongs to an actively managed fund, LCTU by Blackrock at just 0.19%. The BlackRock brand is being used for the company’s active ETFs in lieu of the iShares brand for its indexed products. Continuing this aberration, the three most expensive ETFs are all indexed including the two from INVESCO, PBW and PHO, along with QCLN from First Trust.
- Only LCTU (2.4%) and PBW (2.2%) provide good dividend yields for investors, about 120 and 100 basis points respectively of SPY. Of the remaining ETFs, only ESG has a dividend yield above 1%. The Price/Earnings ratios available on these ETFs are higher than that of SPY and two have negative P/Es. On the other hand, except for ECOZ, most of the Price/Book ratios are right in line with SPY, very close to 5.0 with ETHO and LCTU having the best ratios. On a stock constituent basis however, rather than a position-weighted average, ValuEngine’s valuation ratings can help locate an above-average number of undervalued stocks in all of these ETFs other than PHO, the clean water ETF. PBW is a particularly fertile hunting ground with 69 of its 79 stocks classified as undervalued including top ten holding Daqo New Energy (DQ). With an outperform (4) rating, Jinkosolar holdings (JOS) may also be worthy of a long look. One caveat, about half of PBW’s holdings are small-to-micro-cap stocks so there may be issues with liquidity.
- Most of these ETFs are relatively small in Assets Under Management (AUM). The exception, surprisingly to me, is also the youngest. BlackRock’s LCTU, the most institutionally priced, has more than $1 billion in AUM. Three others, ETHO, QCLN and ESGA are also over $100 Million in AUM. Despite its long history and the highest rates of return of this group of ETFs, PBW has just under $30 million in AUM. All three of the remaining ETFs are under $15 million in AUM with less than $5 million in ESG. I am not an alarm-bell sounder on low-AUM ETFs. The funds are backed by the underlying securities and even if a sponsor closes a US-stock-based ETF, investors will get out whole. Since these consist primarily with large-to-midcap US stocks, investors should do fine in the event of liquidation. ESG by FlexShares is probably the most immediately vulnerable to possible liquidation.
In summary, ValuEngine’s models are calling strongly for a rally in these impact ETFs, particularly the three focused most directly on clean energy: QCLN, PBW and PHO. ESGA is the highest rated active fund and also has better last-12-month performance than the other two. Going against the price trend and most pundits believing that clean energy stocks will remain out of favor for the foreseeable future, contrarians may wish to swoop in now. ETHO and ECOZ also should both be attractive now to contrarians.
Although I generally discourage impact investors from quarter-to-quarter or even year-to-year performance comparisons, there is nothing wrong with having timing on your side if our models turn out to be prescient. However, I urge high conviction investors to look at the downloadable holdings files to make sure that holdings are in alignment with their values but not to worry too much about short-term fluctuations.
This is where some investors including yours truly may have a problem with semi-transparent ESGA, otherwise a very attractive investment option. It uses a proxy holdings file containing decoy securities to protect its positions. That may help the American Century team by being front-run in trades but provides less comfort on the values-in-alignment investor. Personally, for this reason, I hold a position in one of my portfolios in ECOZ which is a fully disclosed active ETF with a Chief Investment Officer, Linda Zhang, that I know well and for whom I have a very high personal regard..
Recently, I added a smaller position in STNC by Stance Capital despite its very short history. STNC represents perhaps the best compromise to full position disclosure and opaque trading basket protection to shield ETFs from potentially large impact trading costs. It uses Shielded Alpha fintech from Blue Tractor Group. The result is that I know 100% of the stocks owned by STNC but competitive traders cannot see the amounts of those shares, if any, that may be sold (or bought) that day. STNC Founder Bill Davis is also someone I’ve followed for years and is also well respected in the “ESG Circuit.” So as with many portfolio managers and investors as well as in keeping with the category, personal preferences play a role in how I wish to align the investment dollars under my aegis with my convictions. Everyone should do their own research and exercise their own judgments.
By Herbert Blank
Senior Quantitative Analyst, ValuEngine Inc