New CEO at Top Ranked LyondellBasell Inherits Cracking Good Results

Interim CEO Ken Lane (53) will lead LYB for the coming months after former CEO Bob Patel left last month to become the CEO of W.R. Grace & Co., the most recent addition to the Standard Industries conglomerate.   We like that, similar to his predecessor, Interim CEO Lane has been LYB’s EVP for Olefins & Polyolefins for the last 3 years.   The Interim CEO is coming in at a benign time in the cycle with rising oil prices, strong financial performance, and an increased dividend (4.5%) and new share repurchase authorization.  The Board has hired Peter E.V. Vanacker (55) to take over as the full-time CEO by or before June 2022 but a definitive start date has not yet been set.  Currently, Vanacker is the President & CEO of the Neste Corporation, a TTM €12 billion sales refiner/recycler of diesel fuels that does business with LYB.  The CEO-elect also has good prior industry experience with CABB Chemicals and others.

Pay & Incentives:   The CEO-elect is receiving an initial pay plan we value at over $16 million in his first year, but we like the private equity orientation of the management pay plan at LYB with executive salaries targeted at 20% or less of total pay and 45-60% of pay linked to performance vesting.  His predecessor’s total pay for 2021 has not yet been formally disclosed but averaged about $16 million over the last three years (~170x the median employee’s).   Management’s annual cash bonuses are determined by 3 good target metrics of: EBITDA 60%, Fixed Operating Costs 20%, and Health & Safety objectives (20%).   The new CEO will also receive an initial time-vesting stock grant worth $2.3 million.   Those RSUs will vest in two tranches on his first two work anniversaries and, like his predecessor, he will be required to hold at least 6x his salary in beneficial share ownership by the end of 2026.  His annual long-term target for equity grants is $10 million and those will be comprised of a good mix of performance vesting PSUs (50%), stock options (25%), and time-vesting restricted share units RSUs (25%).

Equity Holdings:   Ukrainian born, centa-billionaire, Len Glavatnik’s CBE (now a dual U.S. & U.K. citizen) holding company Access Industries, has been both a pre-and-post Chapter 11 stakeholder in LYB which was over-levered going into the filing and had private equity firm Apollo as its largest creditor at the time (2009-10).   Apollo eventually exited in 2015 at a huge profit but Access remains a major equity holder and Glavatnik’s tenacity has paid off.   Access Industries stake of about 70.5 million shares represents a stake of about 21% and includes rights to nominate up to 3 Directors.   Access has been a consistent seller of its low-basis shares and options since January of 2020 with net proceeds of about $675 million.   Other than Access, former CEO Patel is the largest personal stockholder with a beneficial stake of about 1.2 million shares but that may represent a potential selling overhang as the former CEO’s average cost basis on his vested shares is substantially in-the-money at about $90.

Fiduciary & Other:     LYB is a Dutch incorporated entity and, as such, subject to Dutch Corporate Governance rules.  Board Chairman Jacques Aigrain (67) is a former Partner of Warbug Pincus, global head of M&A at JP Morgan, and former CEO of Swiss Re.  He joined the Board in 2011, became Chairman in 2018, and presides over a 12 member supervisory board.  As Chairman, he receives a retainer of ~$675k annually, a little more than double the other Director’s retainers, and owns about 20k shares.  He is also a Director of the LSE and WPP.

ValuEngine Says Sell in May and Go Away

A common toast has been: “May 2022 be better than 2021!”  However, where the US Stock Market is concerned, most of us would gratefully accept a repeat of 2021’s returns.

The ETF reports on ValuEngine.com for funds that follow market benchmarks provide a side benefit in writing market analyses.  They are a window to implicit forecasts for 1-, 3-, 6- and 12-month forecasts VE models are making for each benchmark’s ETF portfolio.  This is because the ratings and projections combine bottom-up constituent analysis with analyses of the historical price movements of the ETF in different market environments.  We can use all of this to try to look forward into 2022.

The benchmark indexes and ETFs chosen for this feature are:

  1. The S&P 500 Index representing US Large Cap, the ETF is iShares’ IVV;
  2. The S&P 400 MidCap Index representing US MidCap; the ETF is SPDR’s MDY;
  3. The Russell 2000 Index representing US Small Cap; the ETF is iShares’ IWM
  4. The Russell 1000 Large Cap Growth Index; the ETF is iShares’ IWF;
  5. The Russell 1000 Large Cap Value Index; the ETF is iShares’ IWD;
  6. The Nasdaq-100, constructed as an index using the top 100 non-financial stocks with primary listing on the Nasdaq, but now regarded as the premier US Big Tech Index; the ETF is Invesco QQQ.

Today’s focus is primarily on the 12-month period that will end on December 31, 2022.  On the chart below that is listed as the ValuEngine forecast for 1-year, indicating the next 12 months.  The data in the summary table are all from December 30, 2021, the last trading date of the year that just finished.

MDY IWM IWF IWD QQQ IVV
Market Index Being Tracked S&P Midcap Russell 2000 Small Cap Russell Large Cap Growth Russell Large Cap Value Nasdaq 100  S&P 500
ValuEngine Rating 3 4 4 2 4 3
VE Forecast 3-mo. Price Return 0.1% 0.4% 1.5% 0.4% 1.5% 1.0%
VE Forecast 6-Mo. Price Return 0.6% 1.1% 3.6% 1.4% 3.5% 2.6%
VE Forecast 1-yr. Price Return -5.2% -2.9% -2.2% -6.2% -2.0% -4.3%
Historic 3 mo. Price Return 7.7% 1.7% 11.5% 7.3% 11.1% 10.7%
Historic 6 mo. Price Return 5.4% -3.0% 12.6% 5.9% 12.3% 11.0%
Historic 1-Yr. Price Return 23.3% 13.5% 26.7% 22.8% 26.8% 27.1%
Historic 5-Yr Ann. Price Return 10.2% 10.1% 21.2% 7.3% 24.2% 14.5%
Volatility 19.6% 21.1% 16.4% 16.9% 17.0% 15.5%
Sharpe Ratio (3-Year) 0.52 0.48 1.29 0.44 1.42 0.94
Beta 1.19 1.22 1.02 1.04 1.02 1.00
# of Stocks 400 2038 503 854 100 500
Undervalued by VE %* 50% 66% 45% 45% 35% 35%
P/B Ratio 2.8x 2.8x 14.4x 2.7x 9.3x 4.8x
P/E Ratio 24.4x 183.2x 39.8x 21.5x 34.1x 27.0
Div. Yield 1.0% 0.9% 0.5% 1.6% 0.4% 1.2%
Expense Ratio 0.23% 0.19% 0.19% 0.19% 0.20% 0.03%
Index Provider S&P Dow Jones FTSE Russell Indices FTSE Russell Indices FTSE Russell Indices Nasdaq S&P Dow Jones
Index

Scheme

Mkt. Cap Weighting Mkt. Cap Weighting Mkt. Cap Weighting Mkt. Cap Weighting Mkt. Cap Weighting Mkt. Cap Weighting
ETF Sponsor SPDRs by SSgA iShares by Blackrock iShares by Blackrock iShares by Blackrock Invesco iShares by Blackrock

In order to frame our forecasts, let’s look at the ValuEngine rankings that summarize our models’ views on the expected price appreciation of IVV. This is an ETF built to replicate performance of the S&P 500 Index which is the most common benchmark for active management and the focus of most market forecasts.  IVV has a rating of 3 thus predicting average performance among the ETFs in our universe during the next six months.  Given its bellwether status as the market’s proxy, a rating of 3 is the norm for IVV.  The ValuEngine market forecasts for IVV – and thus the S&P 500 – will vary from negative to positive depending on our models’ assessments of the current environment.

Focusing on the S&P 500 column in the four rows containing our forecasts, our models expect the market to navigate the next three-to-six months in modestly positive territory.  However, with a 12-month forecast of -4%, even a six-month 3% gain, our models forecast a mild correction during the second half of 2022.

Are there segments of the market for which the ValuEngine models have a more positive outlook?  There are differences but not very sizable ones.  QQQ, still rated 4 (Buy), gets out least negative price forecast; we predict a dip of just 2%.  IWD, rated 2 (sell), has the lowest prediction for calendar year 2022 of -6%.  For those wondering how an ETF with a projected decline for 2022 can have a “buy” rating, it’s important to understand that ValuEngine ratings are assigned relatively.  Therefore, in this environment, “buy” should be thought of as “above average.”

The ValuEngine models currently favor growth over value with IWF, the ETF based on the Russell 1000 Growth Index rated 4 and expected to endure less than half the decline of IWD based upon the Russell 1000 Value Index.  The models predict one reversal of historic trends.  Although IVV (large cap S&P 500 ETF) has outperformed IWM, (small cap Russell 2000 ETF) consistently and decisively during the past 5 years, IWM now receives an above average rating of 4.  IWM’s largest position is AMC Entertainment, which is also rated 4 (buy).  Additionally, we rate 66% of IWM’s holdings as undervalued, the only one of the six benchmark index ETFs that doesn’t have 50% or more of its holdings rated as overvalued.

Thus, the answer to the perennial question appears to be yes.  No matter which of the major six benchmark categories you choose, our models say you are likely to enjoy positive returns during the first half of the year but if you continue to hold a benchmark index-based ETF for the rest of 2022, you will give back all the gains and lose a bit more.   ValuEngine’s model predictions are fallible as most predictions tend to be.  The models’ projections have tended to predict the direction of the trends more than they’ve been incorrect.  Magnitudes can be more difficult.  In this blog entry that was posted at the end of September, we projected a week positive return for most of the benchmark indexes averaging about +1.5%.  They were indeed positive but the magnitude was correct only for small cap IWM.  The other five benchmark index ETFs fourth quarter price returns ranged from 7.3% for Large Cap Value IWD to 11.5% for Large Cap Growth IWF with the S&P 500 ETF, IVV, between the two with 10.7%.

I’ve seen several well-known strategists, including the venerable Byron Wein, also project a decline or correction of the S&P 500 between -2% and -15%.  That may portend that our forecast will turn out to be accurate, but it could just turn out that misery loves company.  The next question is to determine where investors who lower their exposures to one or more of these six benchmark index categories should re-allocate their dollars.  That will be the subject of our next blog.

The Long & Short of VooDoo SPAConomics (part 1)

Note most data as of late 2021 due to embargo period.

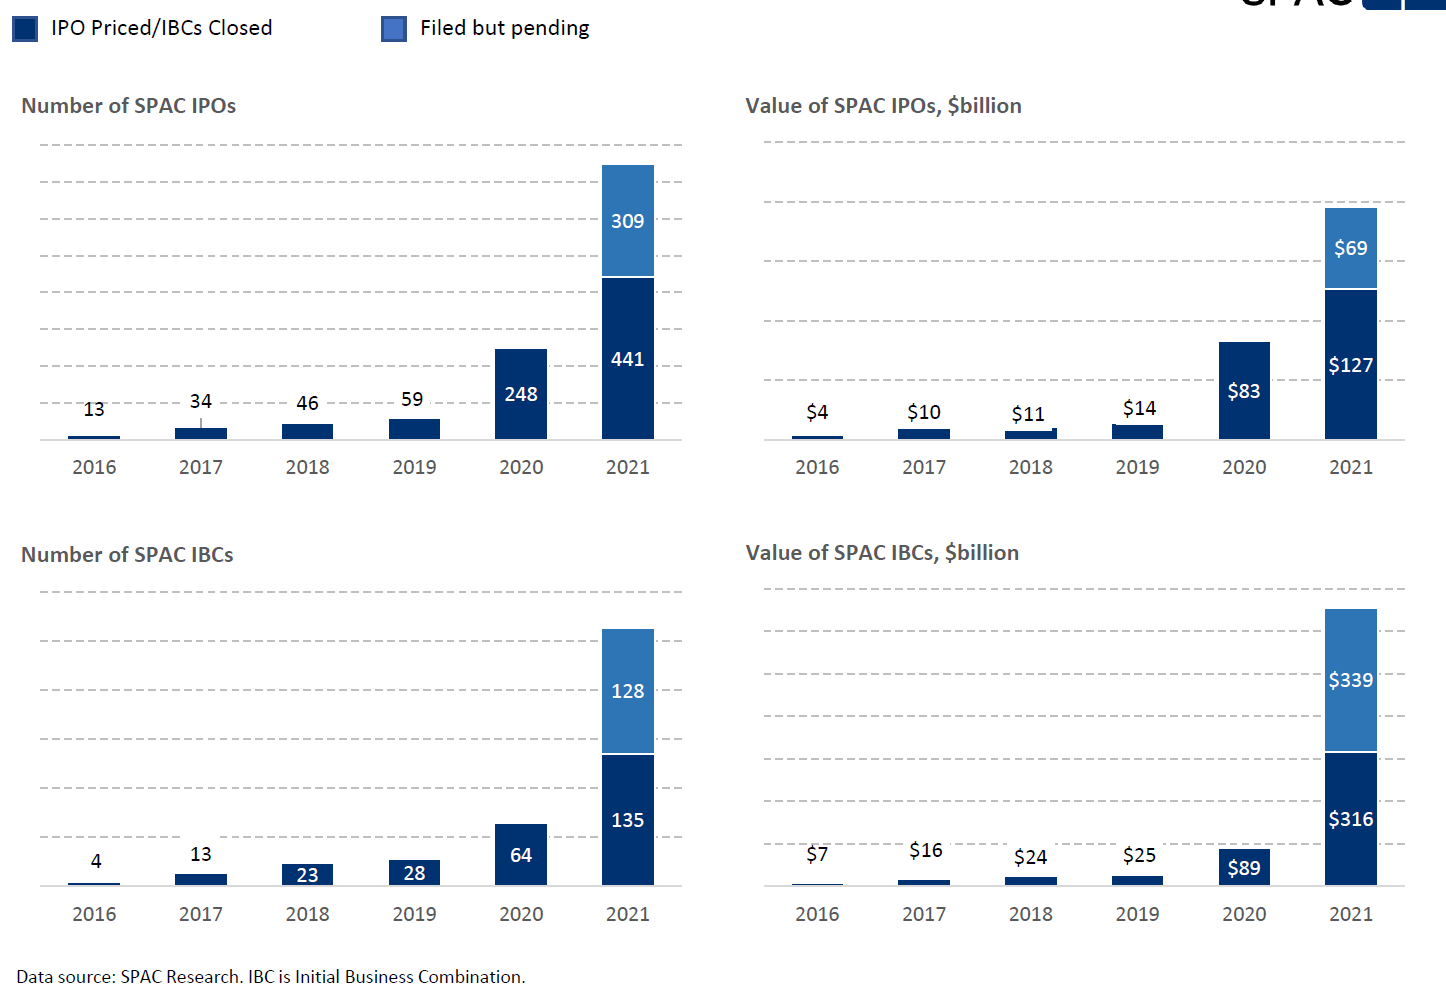
While the SPAC boom of 4Q20 and 1Q21 has not continued, there has still been a lot of activity in the space in 2021 and will be for more than a year even if another single SPAC IPO does NOT occur.  While much has been made about the slowdown in the SPAC market, the SPAC IPO market is not dead yet as just last week, 6 IPOs occurred raising $1.2bn, 2 new targets were announced with an EV of over $2.1bn, and 3 transactions were closed with a combined EV of over $4bn.  Please see the charts below from SPAC Research

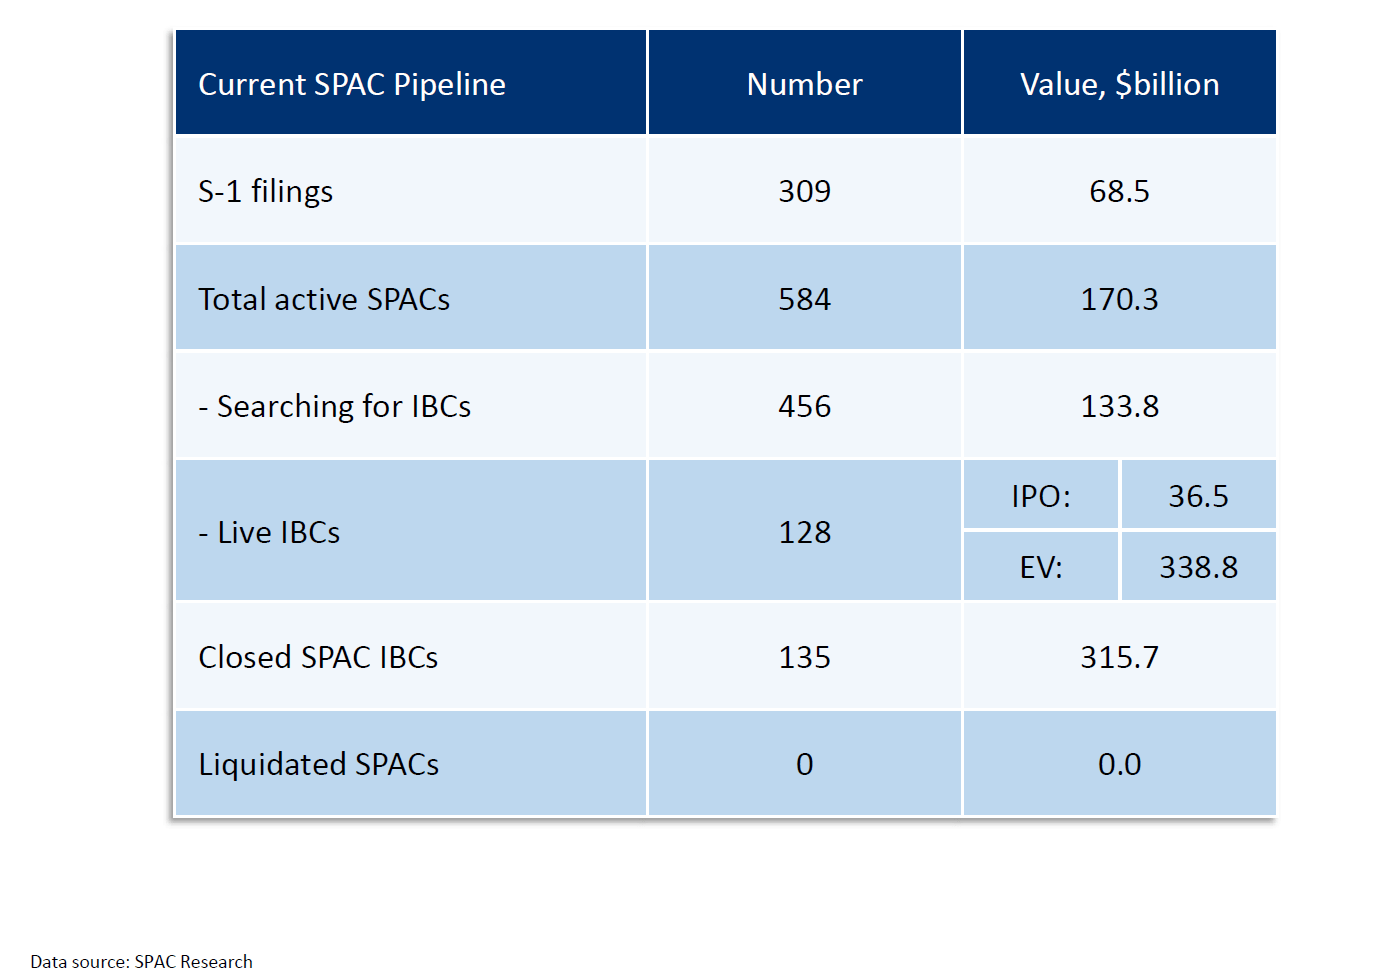
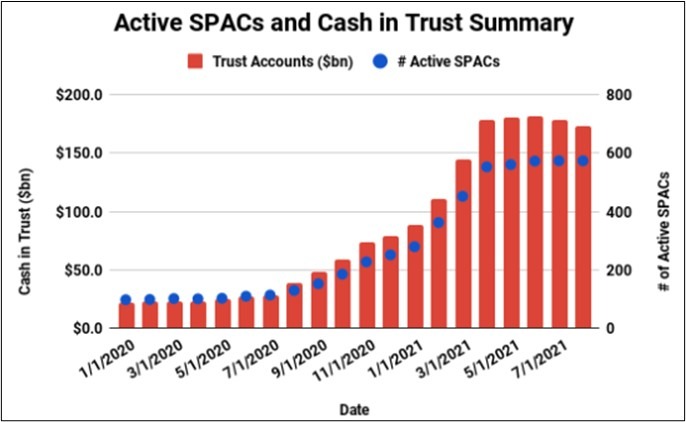
The table below shows the current SPAC pipeline.  Note there are still over 450 companies shopping for a target company and over 125 SPACs that have announced a target but have yet to close the deal.  This represents hundreds of billions of dollars of enterprise value.  The bar chart below also shows the trend in the aggregate amount of capital in trust and active SPACs from about a month ago.  SPACs are now competing more directly with private equity groups and strategic buyers for acquisition candidates. The result is probably increased valuations.  This may prove to be problematic if valuations are moving higher for structures that inherently have more dilution.

While all the data above is staggering, it may be helpful to understand the timeline or life cycle of a SPAC

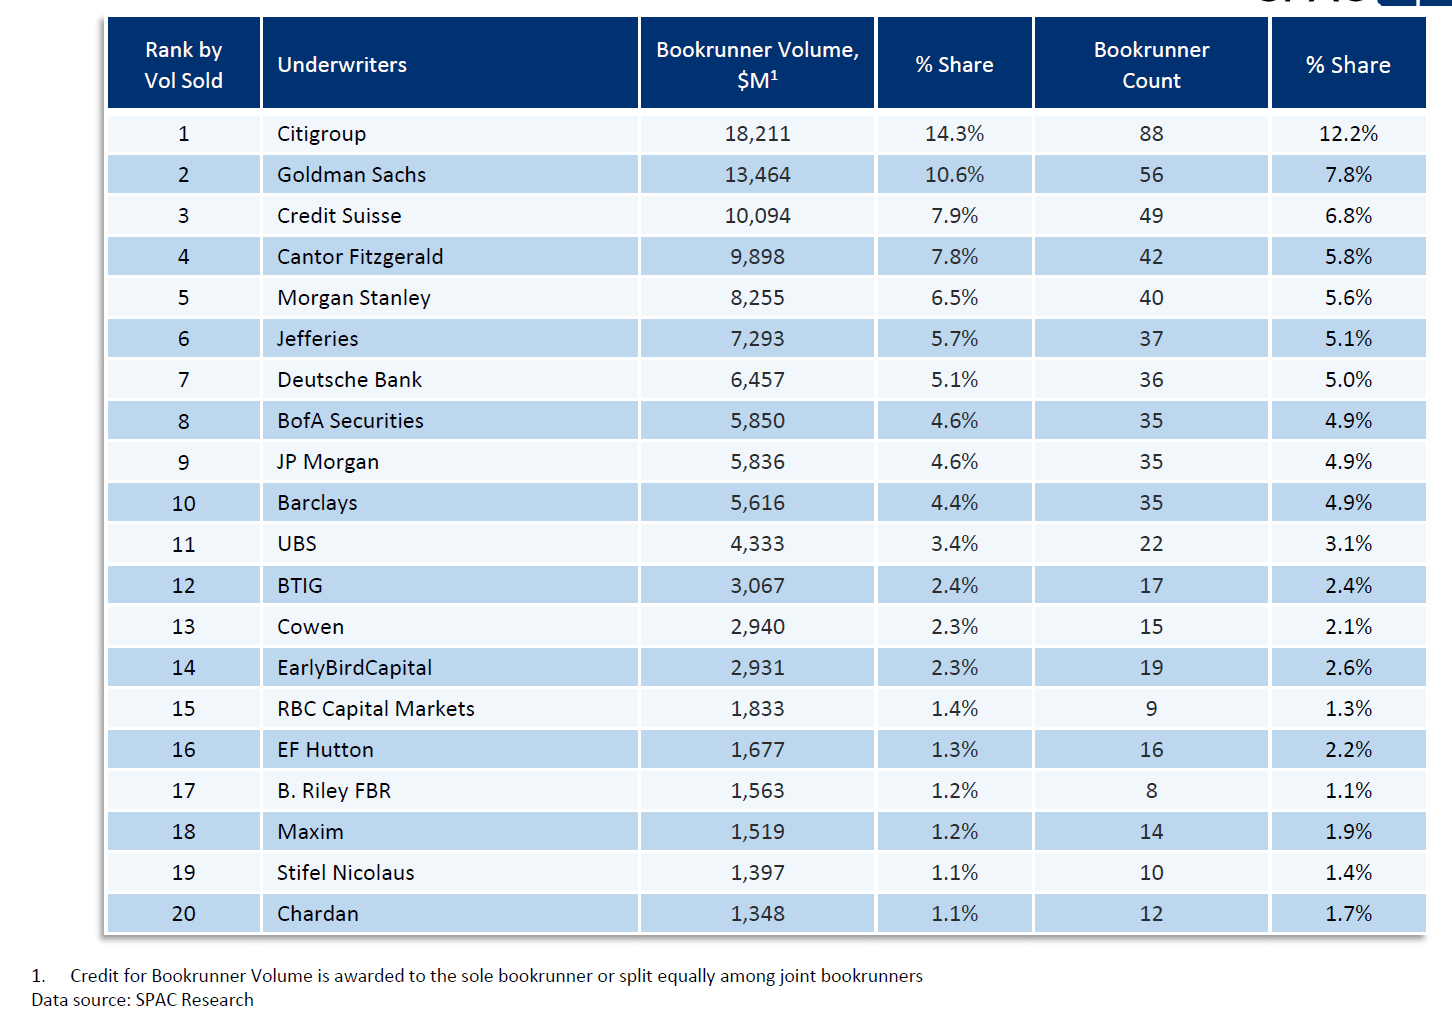
The life of a special purpose acquisition company (SPAC) begins when a sponsor forms an entity, hires underwriters (see YTD Underwriter market share table below) and files an S-1 to do an initial public offering.  The sponsor is someone that believes that they can raise capital for the purpose of acquiring a company.  Another name for a SPAC is a “blank check” company as investors are in effect giving the sponsor a blank check with which to go find a company to buy with the capital raised.  At the time the SPAC is formed, it does not have any commercial operations and could be viewed as a shell company.  This enables the private company to go public without enduring the cumbersome traditional IPO process with the SEC.  Additionally, while similar to a reverse merger, a SPAC shell company is “clean” in that there are not existing operations, assets and liabilities, etc., that need to be valued in a traditional reverse merger.  Lots of institutional investors are IPO investors due to the arbitrage opportunities that can exist up until deal closing and the optionality that exists with the ability to redeem stock and obtain warrants (discussed later)

Sponsors typically have operational, M&A, industry, or private equity experience and are highly incentivized to close a transaction.  They do not receive salaries, fees, or other forms of compensation until a transaction is consummated.  In fact, they may be responsible for lawyers’ fees, D&O insurance (which has skyrocketed), and other costs.  However, they typically receive a 20% equity position in the SPAC (known as the sponsor promote), excluding any warrants they receive. Consequently, as they approach the deadline to close a transaction, conflicts of interest may intensify as sponsors need to get a deal done to make money (and underwriters to collect some of their fees).  Even if the sponsor is willing to pay a lot for a low-quality company, their cost basis is much lower than all the other SPAC shareholders, approaching $0, allowing the sponsor to make $ even if the SPAC or new entity trades significantly below trust value.

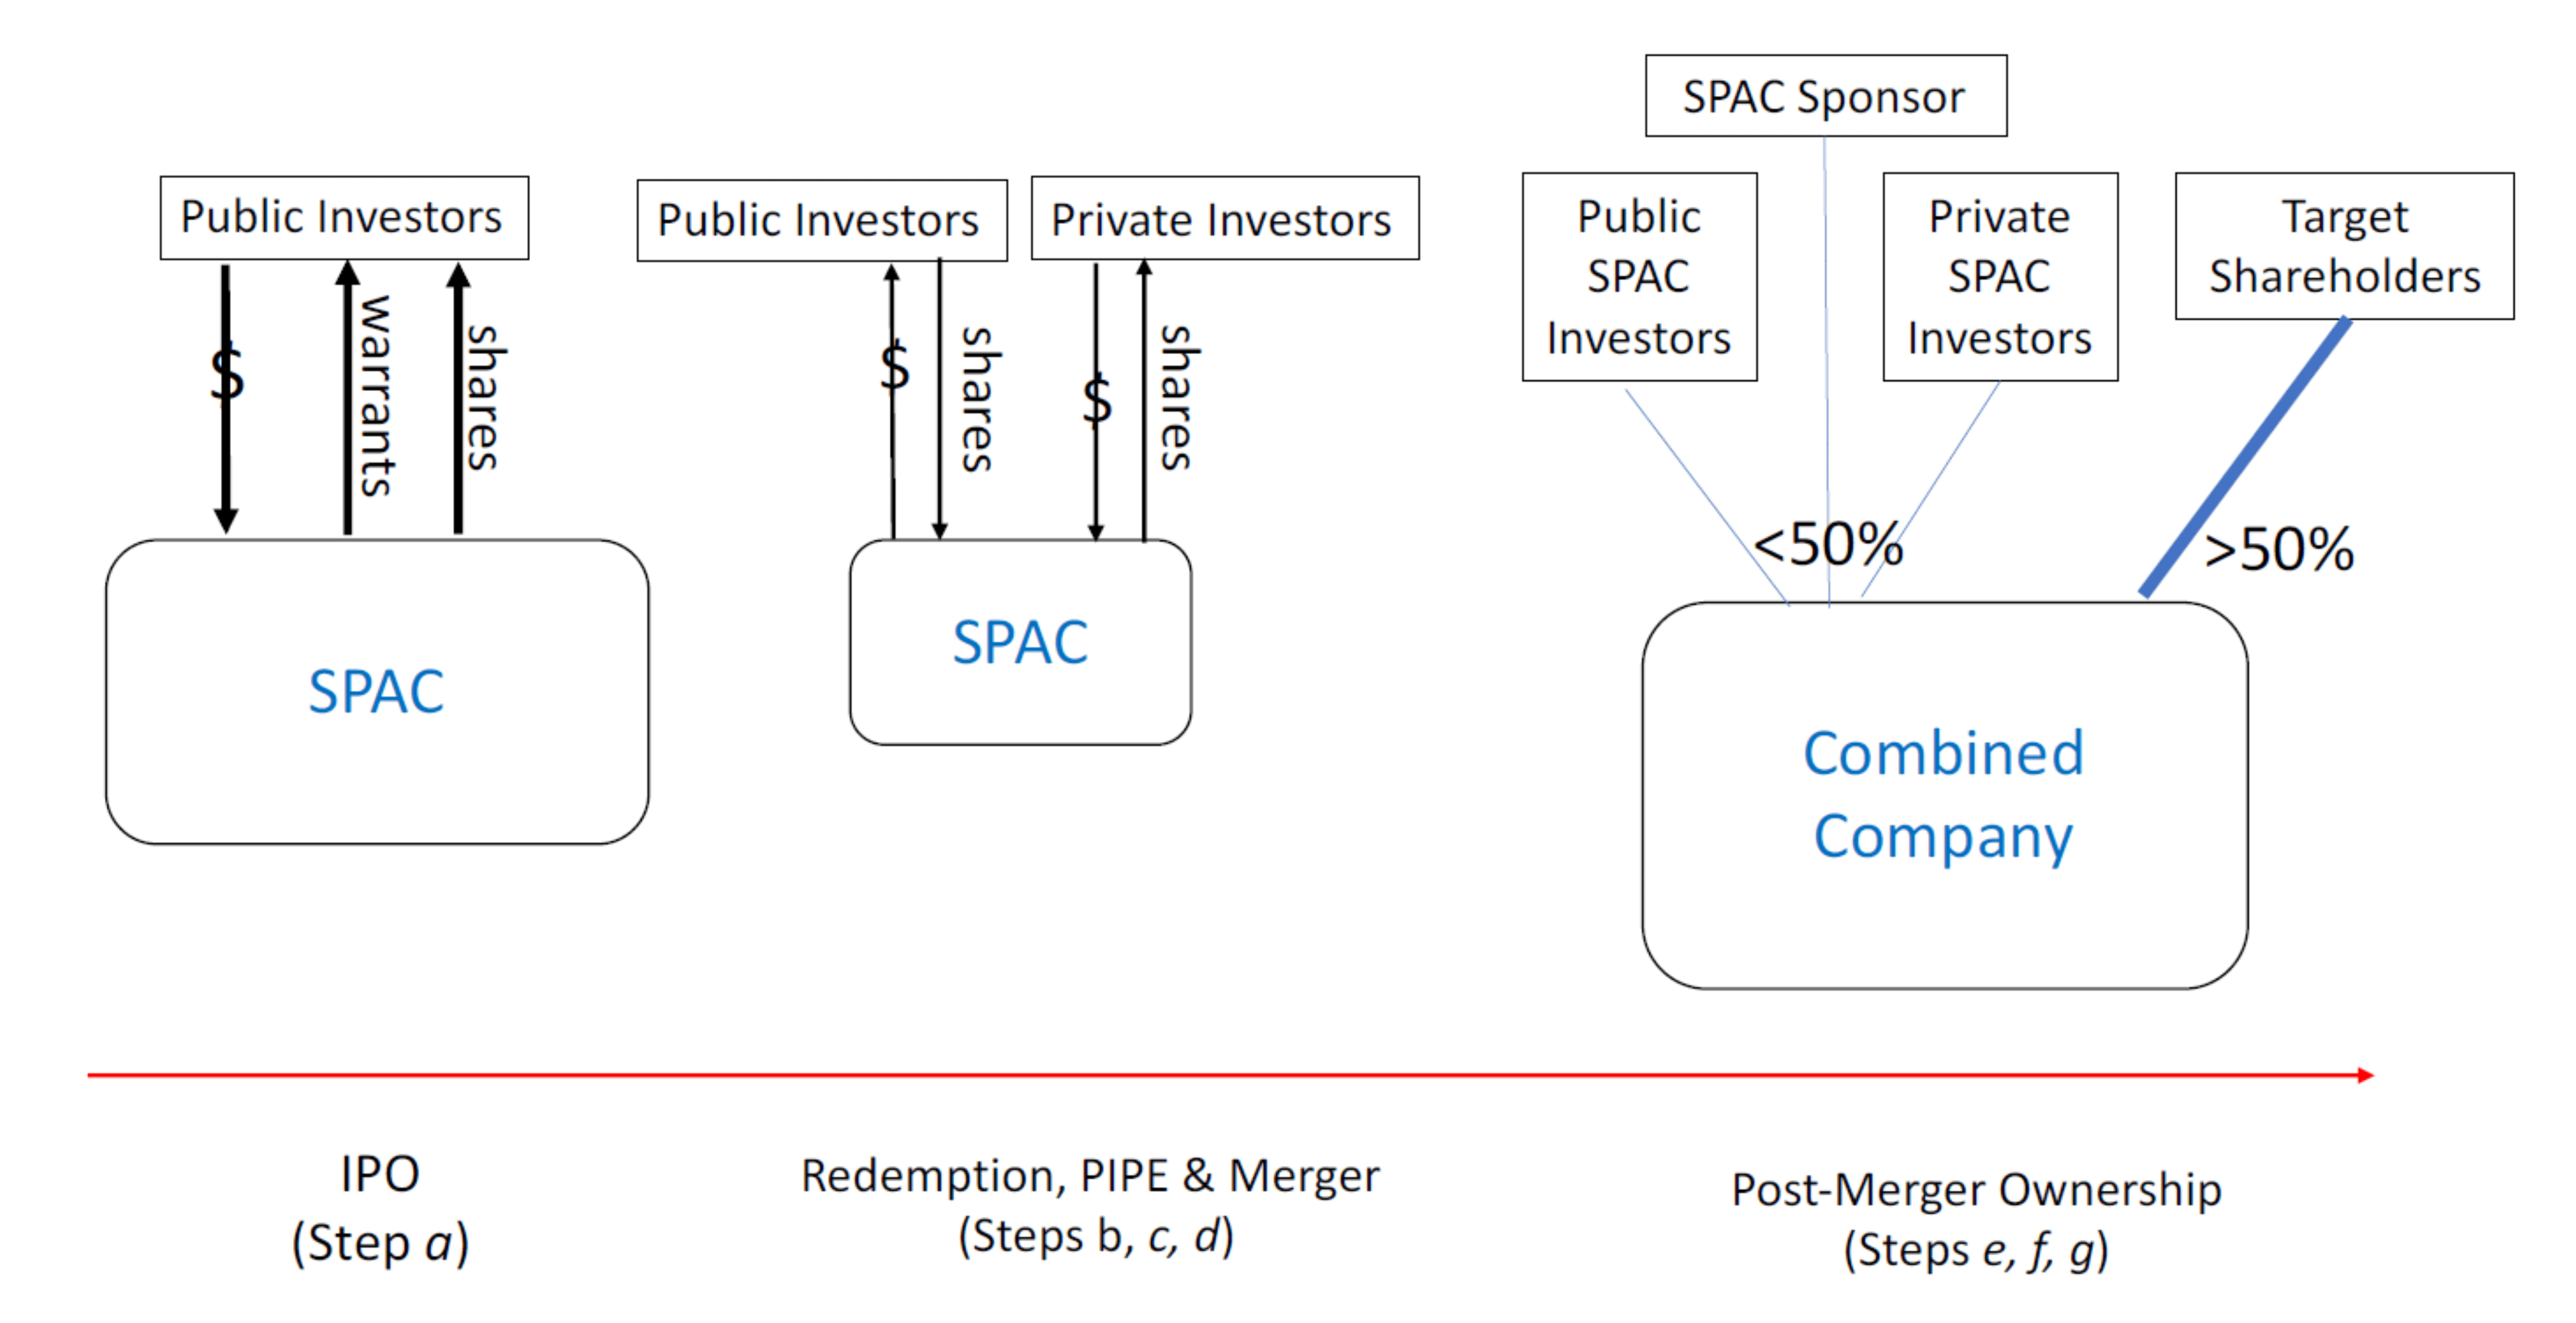
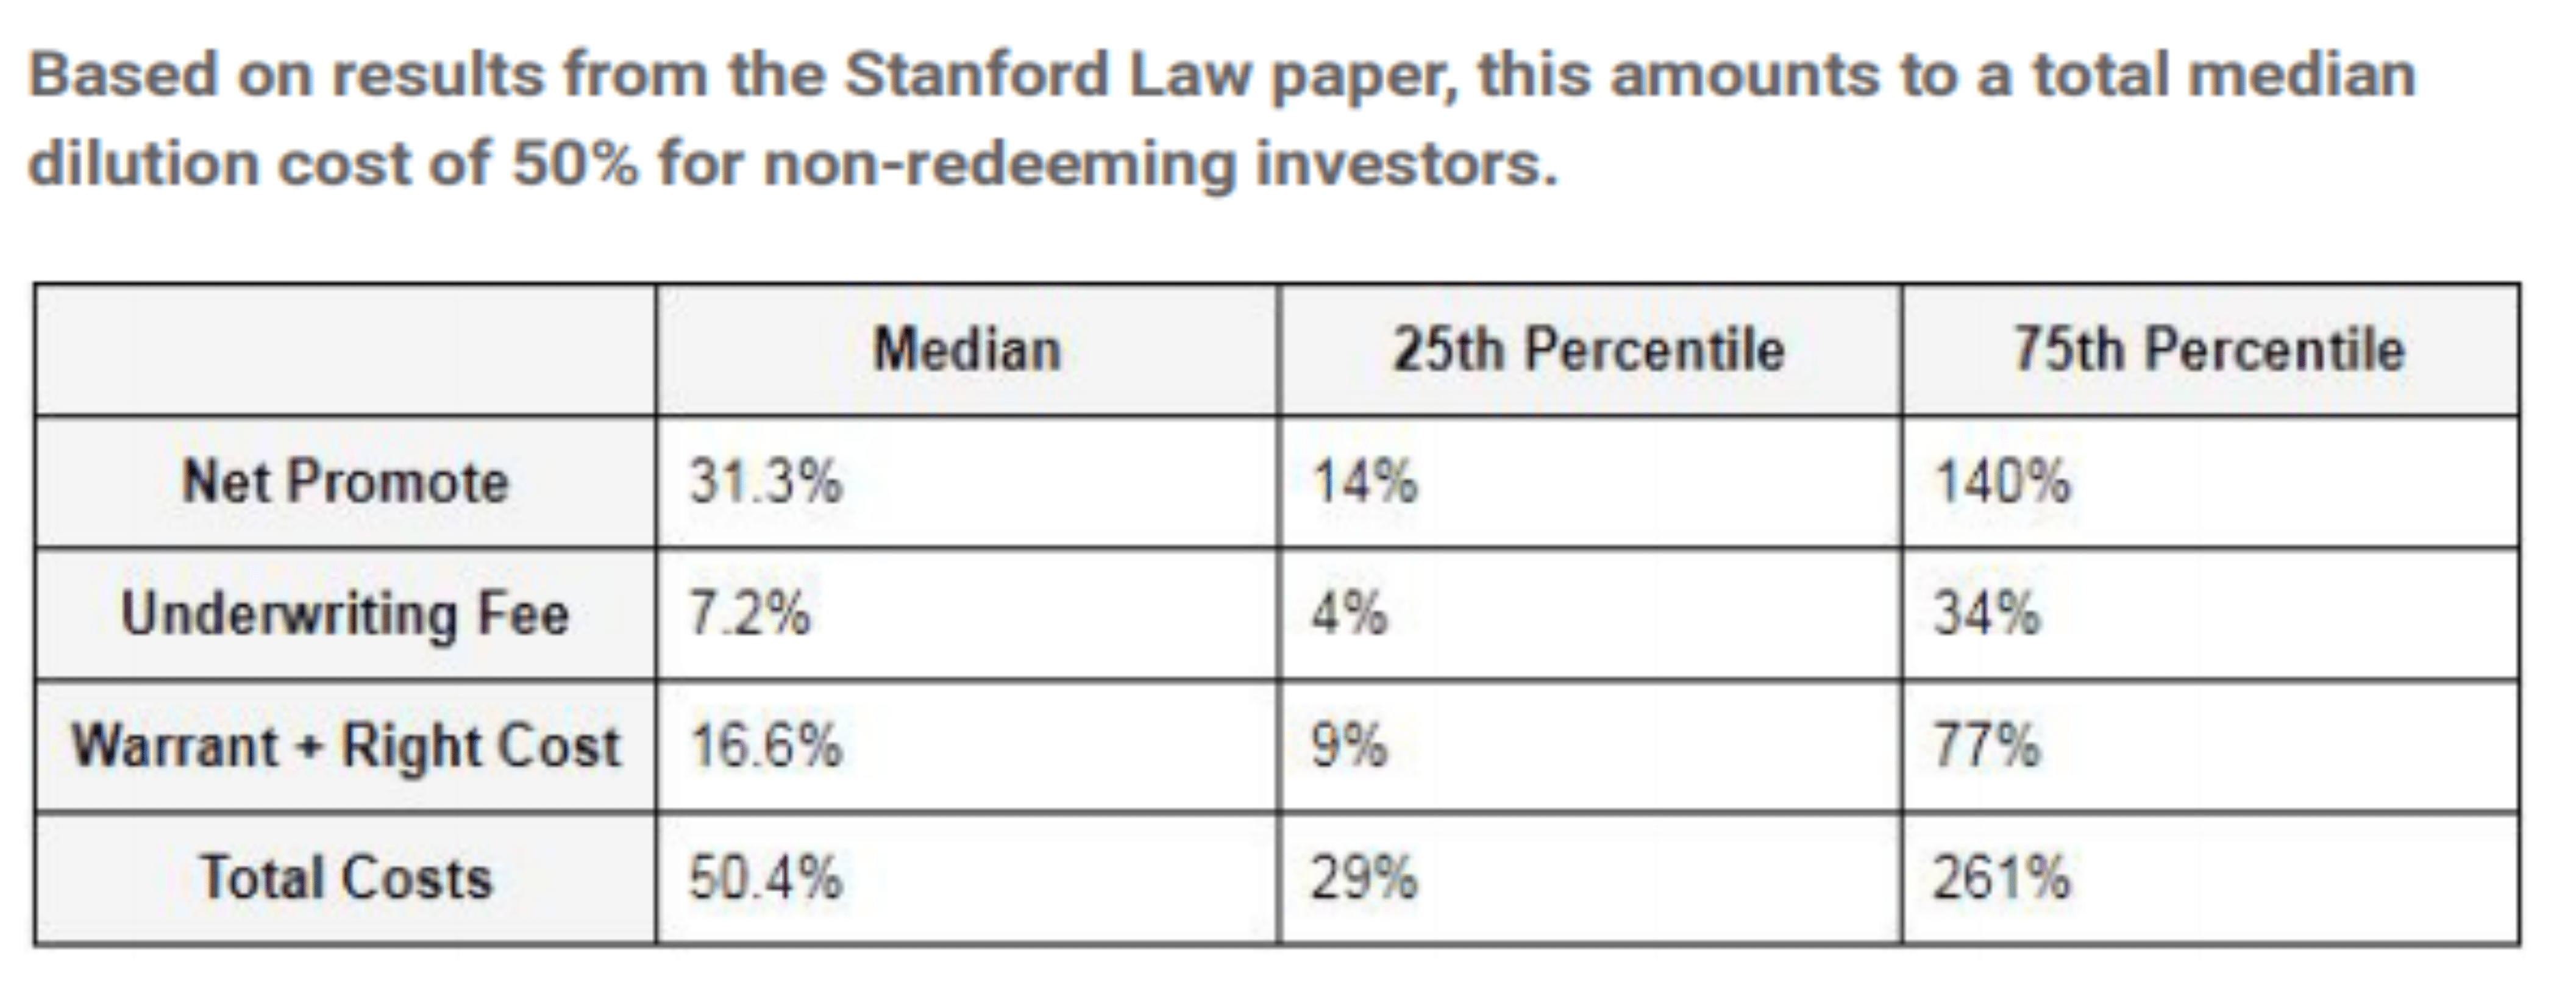
Speaking of trust value, the typical SPAC IPO price is $10.  For $10, an investor receives 1 unit (see Step A above).  A unit usually includes 1 share of stock and a partial or full warrant.  In most cases, a SPAC with higher quality sponsors and underwriters tends to offer less warrants to entice investors than a management team that is deemed riskier or underwriters seen as lower quality.  For example, a high- quality SPAC may include 1/5th of a warrant with each share of stock in a unit but a lower quality SPAC may include a full warrant with each share of stock in a unit.  This affects future dilution as the lower quality SPAC would have approximately 5x as many warrants.  Dilution should be a focus of all SPAC investors as the table below details how much dilution can occur due to warrants, the sponsor promote, and the underwriters.

Not long after the IPO, the unit will split and the stock and warrants will trade as separate securities.  Public shareholders may trade their stock and warrants.  Sponsors are usually locked up for some period of time until after the merger.

The $10/unit are put into a trust.  These proceeds in the trust cannot be used for anything but cash consideration for the target company.  The trust can earn interest income and so the trust/share value can actually slightly exceed the $10/share amount.

From the IPO to the time of the announcement of an acquisition target, the SPAC shares may trade from slightly below trust value (typically $10) to multiples of trust value based on liquidity, target industry, rumors about potential deals, the overall stock market, and optimism about a SPAC sponsor.  If investors can find SPACs trading below trust value prior to a target announcement, this can be a good opportunity to buy shares.

The sponsor typically has 2 years to find a company to merge with/buy.  When a sponsor announces a target, the stock will react based on how shareholders and the market feel about the deal.  At this time the sponsors and target company will share a presentation about the merger terms and financial projections.  The projections are often referred to as Safe Harbor projections.  Basically, a management team can provide extremely bullish estimates with no realistic chance of achieving those goals.  Some SPACs provide reasonable guidance while many others project massive growth rates and margin expansion over the next 5 years.  There was even a SPAC that provided guidance 20 years into the future.  Investors looking for volatility or who are confident the sponsor will announce a good deal, may want to own shares prior to the target announcement.

Often after the announcement of a target, the sponsors will seek to raise additional capital through a PIPE.  PIPES can be a good way to invest in SPACs as the investors often receive additional incentives to participate in the PIPE and can often have lockups that expire before sponsor and target shareholders. Additionally, PIPE investors may get to see financials of the target before the deal is announced and before public shareholders.

The existence of a substantial pipe being raised, especially if quality investors are involved in the PIPE, can be a bullish indicator.  Additionally, the size of the PIPE can change.  If a SPAC set out to raise a $50mn PIPE, and it is upsized to, say $75mn, that may also be a bullish sign.  Conversely, if the PIPE were downsized to less than $50mn, that could be viewed as a bearish sign.  The good thing about funds raised through a PIPE is that they are much less dilutive than funds raised from the IPO as they don’t have the 20% sponsor promote.  Therefore, all else being equal, an investor should prefer that more of the cash used in an acquisition of a target to be sourced from a PIPE than the SPAC IPO.

After announcement, the sponsors and the target company will try to finalize all the details and continue to update SEC filings until they have the final meeting prior to deSPAC.  Prior to this date, shareholders are allowed to redeem their shares.  This means that a shareholder may return a share of stock for the IPO price (usually $10), in effect, getting their money back.  If the investor was an original investor in the SPAC IPO and had paid $10 for a share of stock and 1 warrant, the investor would return the share of stock, receive $10, and get to keep the warrant.  If an investor purchases the stock sometime after the IPO, the investor could still return the stock for $10 but would not have the warrant.  This redemption process can produce some arbitrage opportunities and also generally can put a floor in the stock price.  For example, the stock is trading at $10 and the sponsor announce a target that is not well received and the stock trades down to $9.  The stockholder can still redeem their stock for $10 prior to deSPAC.  Given the ability to redeem for $10, the stocks usually do not trade for big discounts to trust value for very long prior to deSPAC, as investors would snatch them up and redeem for a profit.  In addition, SPACs usually do not see big redemptions, if the stock is trading significant above trust value because why would an investor want to redeem a stock at $10 if it could sell it in the open market, for say $17.

If too many shareholders redeem their, this can affect the ability to complete the transaction.  A minimum cash contribution exists for most deals.  For example, a deal could have a minimum cash contribution requirement of $100mn.  Let’s say a SPAC sold 20mn shares at $10/share and raised $200mn, but 75% of shareholders redeem.  Those redemptions result in the trust only having $50mn which is only half of the minimum cash contribution.  The SPAC sponsor may then have to seek a waiver or find other sources of cash to keep the deal from terminating.  The sponsor may seek to raise a PIPE, sell/contribute some of the sponsor shares, issue debt, or some other form of capital raising.

*The conclusion of this article will appear in an upcoming issue of Signals.  The complete white paper is available on request for a limited time, please see below.

NextEra: Leaning Into the 21st Century

Note: The following is a brief extract from Management CV in depth analysis.  Please contact us for a copy of the full report.

NextEra Energy’s Chairman, President & CEO Jim Robo (58) runs one of the most successful utilities with both regulated and unregulated businesses. The CEO has focused on renewables and achieving scale, acquiring Gulf Power in 2019.  This fall Robo told investors “There is no one better positioned to take advantage of it than we are.  And we’re leading the transition, not just of the decarbonization of the electric grid, but decarbonization of the entire US economy.  The electric grid is going to be the vehicle to decarbonize the transportation sector, it’s going to decarbonize the industrial sector. ”  “We have two terrific businesses. Obviously, FPL, which we think is the best utility in the world and NextEra Energy Resources.  Our goal fundamentally is to lead the transition – this energy transition to decarbonize the economy, I’m very excited about the opportunity in both businesses.   Both businesses are taking advantage of a set of disruptive forces that we see that are really driving this energy transformation and that is the fact that renewable costs wind and solar along with – paired with batteries are cheaper than natural gas, cheaper than nuclear, cheaper than coal.  We’ve been getting a lot of questions of what’s the fact that gas prices have gone up $0.80 on the 10-year strip since the beginning of the year. What’s that mean? Well, it means wind and solar are even more competitive than they were in January this year. So it’s terrific news and we are leading this transition. ”

Compensation and Alignment Analysis

NEE’s management team is unusually well paid but also aligned well with investor interests through major equity stakes and a focus on EPS and ROE incentive metrics.   CEO Robo’s $23.7 million in total pay last year had $16.1 million paid to him in the form of long term equity.   The CEO is paid a large $1.5 million salary and received a sizeable $4.8 million cash bonus last year.    CFO Kujawa’s pay totaled $4.3 million in 2020 including a $2.4 million equity grant.   We also note that the CEO has a lucrative potential severance in the event of Change-in-Control event which is defined at an unusually low 20% outside stake.

Equity Ownership Analysis

We like the substantial equity stakes that NEE Insiders and managers hold in their firm.  They beneficially own about 7.9 million shares worth $714.4 million. CEO Robo is the largest personal holder with about 5.3 million beneficial shares valued at over $479.4 million.  CFO Kujawa’s 103k vested shares are worth about $9.3 million.  Divisional CEO Silagy, General Counsel Sieving, and Division CEO Ketchum each have between 239k and 474k shares worth $21.5 million to $42.6 million.

Capital Allocation Practices

CFO Kujawa has been shrewd in serially tapping the debt markets several times in 2020.  Most recently, the CFO issued over $3 billion of debentures following $2.5 billion in November.   Management has moderately increased its leverage with lower rates. It was $55.3 billion (60% debt/total capital) as of Q3 ’21, up from 2020’s $48.1 billion (57% debt/total capital) and 2019’s $42.6 billion (54% debt/total capital) but the CFO maintained investment-grade ratings (Baa1/A-).   NEE’s cash was $692 million compared to $1.1 billion at year end ’20.  YTD, operating cash flow was $6.2 billion versus $6.3 billion a year ago.  CapEx was $5 billion thus far this year, in line with the $5.2 billion forecast in the year-ago period.

Material Fiduciary Issues

The Board has decreased in size to 12 Directors from 14 after Toni Jennings and William Swanson didn’t run for reelection at this year’s AGM.   Both had reached the 72-year-old mandatory retirement age.   Sherry Barrat (71, Director since 1998) is the Lead Director. She is the retired Vice Chairman of Northern Trust (2012) and is likely to retire at the next AGM.   The many retirements, recent and pending, will be good for this aging Board.  We note that NEE’s ByLaws have an unusually low threshold for a Change-in-Control which is triggered at only 20% outside ownership.

Dividend ETFs By Any Other Name

ValuEngine’s Herb Blank recently studied Dividend ETFs, each of which had the word Dividend in its name.  The analysis focused on identifying the best overall ETF for conservative dividend-oriented investors as an alternative core holding that had more than twice the dividend yield of the S&P 500 while collecting comparable, if somewhat lower total returns.

Their top pick at the time was SCHD, the Schwab US Dividend ETF despite the fact that SDOG, the ALPS Sector Dividend Dogs, had a higher dividend, 3.5% as compared with 3.0%.

That said, there are investors who have reached a point in their lives where they are no longer interested in capital appreciation and are focused only on income. This column is intended for them because there are, in fact, ETFs that provide more income than any ETF with the word dividend in the title.

Here are a few examples and their dividend yields:

QYLD, Global-X Nasdaq-100 Covered Call ETF, 11.3%

BIZD, Van Eck BDC Income ETF, 7.9%

PCEFInvesco Income Composite ETF, 6.8%

KBWYInvesco Premium Yield Equity REIT ETF, 5.6%

In comparison, the highest current yield we could find in an ETF including the word “Dividend” is:

  • DIVGlobal-X Super Dividend ETF, 5.4%

All four ETFs derive these extraordinary yields in unconventional ways.

QYLD matches QQQ’s Nasdaq-100 stock exposures but earns income by selling NDX index call options and passes it on to investors net of fees.

BIZD tracks a concentrated index of US publicly-listed private equity investment companies known as Business Development Companies or BDCs. The ETF buys shares of firms that in turn invest in the debt and equity of mid-sized private firms.

PCEF is invested in three types of yield-focused closed-end funds: investment-grade fixed-income, high-yield fixed-income, and option-writing.

KBWY uses an algorithm that selects mostly commercial and small cap REITs (Real Estate Investment Trusts), then weights these holdings by dividend yield.

If the 5.4% dividend yield of DIV can be considered Super-high, then these ETFs can only be considered Ultra-high as in the Latin Phrase non plus ultra (“none higher”).

This table compares what tradeoffs investors must take, if any, total return or volatility in order to earn an income stream higher than core dividend ETFs.  We include VOO, the Vanguard S&P 500 ETF for comparative purposes.  Positive outliers in each category are bolded in black.  Negative outliers appear in red.

Comparison Table as of Dec. 17, 2021


ETF

Dividend Yield % 1-Yr. Tot. Return 5-Yr. Tot. Return  

Volatility (Standard Deviation)

Approx. Sharpe (5-Yr. Ret. / Std. Dev.) Total Expense Ratio
QYLD 11.% 11.9% 11.2% 13.9 0.81 0.60%
BIZD 8.3% 32.8% 9.1% 32.5 0.28 10.07%*
PCEF 6.8% 17.5% 9.5% 16.3 0.58 2.34%*
KBWY 5.6% 21.4% 1.9% 32.7 0.06 0.35%
DIV 5.4% 23.5% 2.8% 28.1 0.10 0.45%
SDOG 3.5% 19.8% 7.5% 23.2 0.32 0.40%
SCHD 2.9% 24.7% 15.6% 18.7 0.83 0.06%
VOO 1.2% 29.2% 17.9% 18.5 0.97 0.03%

The top line reveals some very attractive features for QYLD.  Not only does it have the top dividend yield by a wide margin but it has the least volatility.  Its approximated Sharpe Ratio comparing total return to risk is very similar to SCHD, the ETF we recommended last week for some substitute core allocation for investors needing more income than VOO provides.

The graph below illustrates the risk-return tradeoff of the 8 ETFs included in the analysis.  For visual comparative purposes, we multiplied yield by 100 and the Sharpe Ratio by 10.

Key Findings:

  1. During the past five years. VOO, based on buying and holding the S&P 500 has been the best growth vehicle but its paltry 1.3% dividend yield makes it unsuitable for income-oriented investors.  It also has the lowest expense ratio.  Readers of this blog know that most investors should buy new shares of Vanguard’s VOO or IVV from iShares in lieu of SPY for two-reasons: a six-basis-point lower fee combined with a more efficient structure that can reinvest dividends and lend its stocks.
  2. SCHD provides an attractive alternative to VOO for income and growth investors with comparable growth and an income stream comparable to the ten-year US Treasury bill.  It is also cost-efficient with the lowest expense ratio available for an ETF with a dividend tilt.  In fact, SCHD also has a lower expense ratio than SPY.  Readers of this blog know that most investors should buy new shares of Vanguard’s VOO or IVV for two-reasons: a six-basis-point lower fee combined with a more efficient structure that can reinvest dividends and lend its stocks.
  3. Although the valuations are not shown on the prior table, SDOG has the best valuation metrics of the ETFs reviewed here and a more attractive yield for an income and growth investor. Its volatility is higher but within acceptable ranges. Its diversified security selection consisting only of five S&P 500 holdings from each S&P sector gives it less concentration risk than DIV, KBWY and BIZD as we will see shortly.  However, those three ETFs do also supply considerably higher dividend yields.  So, if income is actually your only objective, SDOG will not provide nearly as good an income stream.  The expense ratio of 0.40% is also much higher than SCHD and on the high end for other ETFs that combine mainstream holdings with dividend tilts.
  4. DIV, from the Global X family of thematic ETFs, delivers a much higher yield than SCHD, 5.4% as compared with 2.9%. Otherwise SCHD and SDOG are both superior in every way.  DIV is less diversified, more volatile, has historically provided lower total returns and has a higher+ expense ratio at 0.45%.  Therefore, with a ValuEngine rating of 1 (strong sell), DIV is not relatively attractive to income and growth investors. Moreover, since there are four more ETFs here with considerably higher yields, income-focused investors also have better choices available to them than DIV.
  5. KBWY, Invesco KBW Premium Yield Equity REIT ETF, is another ETF with little to recommend beyond its 5.6% dividend yield although the fact that it pays out its income on a monthly basis may interest some.    KBWY is highly volatile, has posted lower total returns than most of its REIT ETF peers and considerably lower than SCHD.  Its dividend-yield weighting scheme produces its superior income stream but also contributes to volatility and low quality ratings.  REIT ETFs are frequently mentioned as alternative income sources.  However, even if income is the only consideration, three better alternatives follow.
  6. PCEF, Invesco’s CEF Income Composite ETF, is a very interesting alternative for income and growth investors and income-only investors.  Its 6.9% yield combines with lower volatility than VOO and all but one of the ETFs we will review today.  It is also well diversified with more than 100 holdings and a number of quality screens integrated into the algorithmic index developed by Alerian S-Network with input from closed-end fund experts.  It provides about half as much growth as VOO but has the fourth-best sharp ratio of this group because of its low volatility.  The only daunting statistic in our analytic chart is the 2.34% expense ratio.  However, the management fee is 0.50% as the 2.34% includes the implicit fees already reflected in the prices of the underlying closed end funds.  Nevertheless, PCEF is a fine choice for dividend-first investors also looking for some capital growth.
  7. BIZD, the Van Eck BDC Income ETF provides a dividend yield of 8.3%.  This, in itself, should put it in the potential selections set of Income-first and income-only investors.  Additionally, BIZD has good momentum with the highest one-year total return of any ETF in our table.  The downsides are very volatile returns, lack of diversification and a shocking expense ratio of more than 10% derived primarily from the acquired fund fees of its underlying BDCs because Van Eck’s management fee is just 0,40%, competitive for specialty asset class ETFs.  One caveat is that BDCs are pass-through securities with income that can be taxed at a higher rate than ordinary dividends.  Investors are cautioned to check this aspect out before buying.
  8. QYLD, Global X NASDAQ 100 Covered Call ETF (QYLD) has been called a hidden gem on Seeking Alpha and TalkMarkets by a number of blog columnists. I concur. Its yield of 11.5% is tremendously attractive for income-first and income-only investors.  Its volatility is the lowest in the table with a highly competitive Sharpe Ratio.  The ETF seeks to provide investment results that closely correspond, before fees and expenses, generally to the price and yield performance of the CBOE NASDAQ-100® BuyWrite V2 Index The CBOE NASDAQ-100® BuyWrite Index is a benchmark index that measures the performance of a theoretical portfolio that holds a portfolio of the stocks included in the NASDAQ-100® Index, also the basis for QQQ,  and “writes” (or sells) a succession of one-month at-the-money NASDAQ-100® Index covered call options. QYLD has an expense ratio of 0.60%, which is 21% lower than its category. The same caveat applies as with BIZD,  Have your tax professional check out the implication for the after-tax income your account will receive. As I always warn, read and understand the fact sheet and Summary Prospectus before buying any ETF.  The devils are in the details.

Blank’s recommendation at this time is QYLD to dividend-first equity investors.  Its 11.5% yield and persistent stability makes it ideal for income-first and income-only investors.  If income is your king, QYLD should make the perfect queen.

Analyzing Twitter After Dorsey

The surprise resignation by co-founder Jack Dorsey (45) likely signals the beginning of the end of an independent Twitter (TWTR).   We think Dorsey relinquishing the CEO title today and his Board seat, effective at the AGM, is good for investors and likely a “tell” that the Board has shifted direction and is planning to put the firm up for sale rather than pursue further organic growth initiatives.   For this mission, the selection of CTO Parag Agrawal (37) as the new CEO is smart.   Agrawal will keep the firm on its current product roadmap while the Directors sort through the many issues involved in a change-in-control.   Dorsey told employees today that Agrawal had been his choice as successor for some time in a “rigorous” process.   We note that former CEO Dorsey was one of the few senior managers at Twitter who has not been a material seller of personal stock over the last two years.  We think major stakeholders, Silver Lake Partners and Elliott Management will look for a liquidity event for their stakes in the coming year.

Management Update:  (snippet)   Parag Agrawal has been with TWTR for 10 years and been the Chief Technology Officer since October 2017.  He is an unknown to outside investors.   According to his LinkedIn page, he has only held short research internships prior to joining Twitter in 2011.  We have no doubts about his engineering expertise and ability but see no credentials suggesting he will be anything but a useful placeholder in the CEO role.

Pay & Incentives: (snippet)  New CEO Agrawal will be paid a salary of $1 million and have a target annual cash bonus of 150%.   He also received a large $25 million incentive stock grant comprised of a 50/50% mix of retention oriented, time-vesting, restricted stock that will vest in 16 equal quarterly tranches beginning in February of 2022, and performance-vesting PSUs that will be vest based on metrics to be determined in April 2022.

Fiduciary & Other:  (snippet)  Effective immediately, Bret Taylor (current COO of Salesforce.com and former CTO of Facebook) became the new Chairman of the 10 person Board, replacing Patrick Pichette (former CFO of Google) although Pichette will remain a Director and Chair the Audit Committee.

SPAC Redemptions On The Rise

Voodoo SPAConomics has noticed a trend that we would like to highlight. Redemptions are rising rapidly…that is a greater % of investors are turning in their SPAC shares and getting their $10 back from the trust than was occurring previously. Much of this is due to an increasing number of SPACs trading at or below $10. When SPACs are trading above trust value, fewer investors redeem.

High redemption rates can create issues for completing the merger with the target company because the SPAC has less cash in trust to bring to the deal. Targets that are willing to take less cash to get a deal done may be indicating their desperation. Alternatively, sponsors may have to waive minimum cash requirements or find other sources of cash, often resulting in dilutive transactions. Please see below for an example of what we are seeing that occurred yesterday 9/7/21:

Sustainable Opportunities Acquisition Corp (SOAC) raised IPO proceeds of $300mn on May 6, 2020. It then announced a target, DeepGreen Metals, on March 4, 2021 for approximately $2.4bn. $330mn in PIPE money was also raised, bringing the cash total to $630mn. However, SOAC announced today that ONLY $27mn from the IPO was available as >90% of shareholders redeemed their stock for $10/share. Additionally, SOAC has only been able to collect $110mn of the $330mn PIPE and says that while it is seeking to enforce the funding obligations, there can be no assurances of its success in doing so. The inability to collect money raised in a PIPE is rare and is something we will be watching to see if it becomes a trend. DeepGreen is waiving the closing condition that cash would need to equal $250mn or more since SOAC only has $137mn of cash right now. Shares rose 17% the day of the announcement.

In our opinion, we believe part of this increase in the stock price may be due to a type of short squeeze where investors are short stock, the SPAC shareholders redeem over 90% of the shares, forcing shorts to cover as those shares that have been redeemed can no longer be borrowed. We have seen a number of scenarios like this in the past month.

COMPARING DIVIDEND ETFs

Income-oriented investors disgusted by the pitiful yields available in US fixed income securities during the past five years have turned increasingly to dividend ETFs. However, in the ETF world, dividend-oriented ETFs and ETFs constructed to pay owners the highest possible dividend yields aren’t necessarily the same thing. Today, we’ll compare 5 dividend-oriented ETFs with very different construction rules and performance records. Then we will provide return/yield comparisons with a few ETFs paying very high dividend yields with very different holdings and methodologies.

We selected these popular dividend ETFs for the analysis:

  • NOBL, ProShares S&P 500® Dividend Aristocrats
  • SCHD, Schwab US Dividend Equity ETF
  • SDOG, ALPS Sector Dividend Dogs
  • SPDV, Advisors Asset Management (AAM) High Dividend Value ETF
  • VYM, Vanguard High Dividend Yield ETF

All five ETFs have distinct strategies –

  • NOBL mimics the S&P 500 Dividend Aristocrats Index. Its selection set is limited to the stocks of companies that have increased their dividends for at least 25 consecutive years. Holdings are equal-weighted, with sector weights capped at 30%.
  • SCHD includes firms with a 10-year history of paying dividends. Within that universe, it uses fundamental screens (cash-flow to debt ratio, ROE, dividend yield, and dividend growth rate) to focus on quality companies with sustainable dividends. SCHD is market-cap weighted.
  • SDOG applies the “Dogs of the Dow” theory to the S&P 500 Index on a sector-by-sector basis. The ETF equally weights the five companies with the highest dividend yields in each industry sector grouping (GICS).
  • SPDV selects companies from the S&P500 index with high, positive dividend and free-cash-flow yields. The latter calculation adds depreciation and amortization back into Earnings Per Share then divides that quantity by Price Per Share. This dual measure combined using a statistical transformation, provides the ranking for selection as one of the top five securities in each industry sector grouping (GICS). This newer fund can be thought of as a twist on SDOG that takes cash-flow earnings as well as dividends into account in its selection scheme/
  • VYM is the broadest (400+ names) and in many ways the simplest of these five dividend focused ETFs. Firms are ranked by forecast dividends over the next 12 months, those in the top half are selected before market-cap weighting these stocks.
  • IVV,the iShares S&P 500 ETF, is used for comparative purposes in the chart below. The bold numbers denote the Dividend ETF with the most favorable score in the category.


NOBL SCHD SDOG SPDV VYM IVV
ValuEngine Rating

3

3

1

1

3

3

VE Forecast 3-mo. Return 0.52% 0.27% -0.48% -0.40% 0.07% 0.94%
VE Forecast 6-mo. Return 1.76% 1.25% -0.37% -0.10% 0.80% 2.68%
VE Forecast 1-yr. Return -4.34% -4.14% -5.82% -6.03% -4.43% -4.26%
Historical 3-Mo. Price Return 0.84% 0.25% -1.35% -0.77% 2.51% 2.76%
Historical 6-Mo. Price Return 2.77% 1.03% -4.55% -4.01% 2.83% 9.51%
Historical 1-Yr. Price Return 17.92% 21.13% 16.31% 20.72% 22.96% 26.55%
Historical 3-Yr Annualized Price Return 15.95% 20.49% 11.86% 10.06% 13.81% 23.35%
Historical 5-Yr Annualized Price Return 11.86% 12.42% 5.23% 3.47% 8.35% 15.38%
Volatility 15.3% 15.9% 19.6% 21.6% 15.4% 15.5%
Sharpe Ratio 0.78 0.78 0.27 0.16 0.55 1.00
Beta 0.94 0.98 1.16 1.10 0.95 1.00
# of Stocks 66 100 51 56 412 500
Heaviest Industry Consumer Staples Finance Utilities Finance Finance Technology
% Weight 21% 22% 12% 20% 23% 33%
% of Stocks Deemed Undervalued by VE 45% 68% 64% 74% 55% 46%
P/E Ratio 24.6x 18.8x 20.7x 21.2x 20.6x 28.6x
P/B Ratio 3.8 4.0 2.4 2.2 2.7 4.7
Div. Yield 1.8% 2.9 % 3.5% 3.0% 2.7% 1.3%
Expense Ratio 0.35% 0.06% 0.40% 0.29% 0.06% 0.03%
Index Provider S&P Dow Jones S&P Dow Jones Alerian / S-Net S&P Dow Jones FTSE Intl. S&P Dow Jones
ETF Sponsor ProShares Schwab ALPS AAM Vanguard iShares

Key Findings:

  1. There are huge cost differentials among the five ETFs with SDOG the highest at 0.40% and SCHD and VYM tied for the lowest at 0.03%, just 3 basis points higher than
  2. SDOGand SPDV, the two funds with the highest dividend yields, get the lowest possible rating, 1, from the ValuEngine model for the next six-to-twelve months. This indicates that the better dividend yields will not make up for the expected declines in price during the latter part of the 12-month period
  3. VYM, SCHD and NOBL, all rated 3 (HOLD, expected performance in line with market), are also the most popular Dividend ETFs, ranking 1,2 and 3 respectively in assets under management.
  4. NOBL, requiring 25 consecutive years of raising dividends annually, narrows the S&P 500 to just 66 holdings. This type of consistency is as much a measure of sustainable earnings quality as it is dividend yield. This explains the lowest dividend yield of 1.8%. This is why it also has the highest P/E ratio of all the Dividend ETFs. For dividend-focused investors, the investment case for NOBL is less compelling than for the other four ETFs.
  5. SCHD has superior forecasted returns to VYM as well as the higher dividend yield and the lower Price/Earnings Ratio and much higher 3- and 5-year returns. VYM’s yield is only 0.2% lower, has superior recent returns and lower P/B ratios and volatility. Of the five dividend ETFs, the analysis makes it clear why these two have the highest assets under management. For yield- and value-conscious investors, both are worthy candidates for diverting some core equity allocation to them and out of

Herb Blank ValuEngine’s quantitative analyst recommends SCHD to dividend-focused equity investors also looking for competitive equity returns. In most of the metrics that matter most, SCHD rates a slight but tangible edge.

SPLK: Surprise CEO Resignation

Investors got a nasty surprise last week when President & CEO Doug Merritt (58) resigned suddenly and with minimum explanation. Chairman Graham Smith (62) is serving as Interim CEO while the Board conducts a formal search for Merritt’s replacement. We think Smith is a solid interim CEO and unusually well qualified to keep the firm’s transition to a Cloud subscription model on track, having executed on similar models as a CFO in his prior life. He has been on the Board for 10 years and is the former CFO at Salesforce.com and before that, Advent Software. The big data tech stock is down roughly 26% YTD and approaching its trailing two year lows and we wonder if the awkward leadership change might result in putting the Company in play as a strategic acquisition for one of the larger public Cloud providers.

Active ETF Gurus vs. GURU Index ETF

This week’s featured ETF is GURU, Global X Guru Index based on a specific “smart money” hedge fund strategy. Guru’s site claims that the index engineered by Global X and provided by German customized index specialist Solactive AG allows everyday investors to access the high conviction investments among the largest, most sophisticated hedge funds in the world. It uses a proprietary methodology to access the highest conviction ideas from a select pool of hedge funds where the 13F holdings information is most valuable. In other words, GURU “indexizes” an active strategy to capitalize on changes in the quarterly holding positions of Hedge Fund “gurus.” Its objective is to serve as an alpha sleeve rather than as a diversified core equity holding.

An underlying rationale is believing that the highest conviction holdings of the most successful holdings represent “smart money” that can take advantage of stock mispricings caused by dumb money.  This includes retail investors and mutual funds. Empirically, that makes sense as studies during the past 40 years reveal relentless under-performance by the vast majority of active managers over 5-year periods. But will this be true for ETFs run by superstar managers? I’ve written an article available in the ValuEngine Library demonstrating that the much more efficient ETF Structure  levels the playing field for active managers.

Today we examine whether an index ETF based upon a consensus of “smart money” picks by “hedge fund gurus” is superior to active ETFs from fund company “investment gurus.”

We selected these three ETFs for the analysis:

ARKK: ARK Innovation ETF from ARK Investment Management, headed by Catherine Wood;

DBLV: AdvisorShares DoubleLine Value Equity ETF, managed by DoubleLine Capital, headed by Jeffrey Gundlach;

TTAC: TrimTabs U.S. Free Cash Flow Quality ETF from TrimTabs Asset Management, headed by Bob Shea.

All three active ETFs have distinct strategies.

The investment thesis of ARKK’s research-driven process led by Ms. Wood and her team is disruptive innovation. Companies within ARKK include those that rely on or benefit from the development of new products or services, technological improvements and advancements in scientific research. In fund classification terms, this can be thought of as aggressive growth. ARKK’s objective is to serve as an alpha sleeve rather than as a diversified core equity holding.

DBLV employs a fundamental value strategy. The investment team seeks to invest in classic value opportunities in low-multiple stocks of companies with temporarily depressed earnings and in quality value opportunities in durable or disruptor franchises. Please note that Mr. Gundlach is not directly involved in the management of DBLV; its Senior Portfolio Manager is Mr. Emidio Checcone who also manages several of DoubleLine’s traditionally structured equity mutual funds. DBLV can be deployed as a core equity holding or as a value sleeve.

TTAC selects “high quality” companies as identified by the firm’s proprietary free cash flow research and an ESG screen. Mr. Shea and his team utilize a disciplined active management process driven by quantitative models. TTAC can be deployed as a core equity holding or as a high-quality alpha sleeve.

Having set the stage, let’s take a closer look at the data behind the numbers to see how the GURU index ETF measures up to the three actively managed US equity ETFs we selected. The data is as of November 7, 2021.

VOO, the Vanguard S&P 500 ETF is used for comparative purposes. The bold numbers denote the ETF with the most favorable score in the category.


*DoubleLine did not take over management and rebrand the fund until October 11, 2018 so it does not include the prior fund’s performance prior to that date. I supply the number for historical completeness but agree it should be ignored when evaluating Doubleline’s managerial performance.

Key Findings:

  1. ARKK, historically 5-rated by ValuEngine most of the time, currently has a Buy rating of 4. ARKK had the weakest performance of the five ETFs for the past 12 months but had been the best by far during the past 36-month and 60-month periods. It continues to stand out as a superior aggressive growth fund. Characteristic of its style, it has the highest volatility, Beta and Price/Book ratio. Its negative P/E shows its focus on nascent companies not earning money yet but that they expect to realize superior growth within the next five years. Thus far, ARKK has rewarded investors with above average compensation for that risk with a Sharpe Ratio of 1.15. A pleasant surprise for an aggressive growth investor is a dividend yields of 1.8%, 50% higher than the 1.2% currently offered by VOO. Aggressive growth funds very seldom pay above average dividends but ARK investors receive an unexpected bonus here. Even net of its 0.75% expense ratio, ARKK has been an excellent selection for Alpha generation. Some pundits believe ARKK’s current asset levels have outstripped its strategy’s capacity to earn superior returns in the future. Conclusion: ARKK is too volatile as the core equity holding for most investors but is very attractive as an alpha sleeve or satellite holding. If you are looking to take 10% out of your core to try to earn above-average returns, ARKK remains a solid choice.
  2. DBLV, is rated 3 by ValuEngine (classified as a HOLD rating) meaning we expect it to deliver performance in line with the market. However, the lower future return projections indicate that our models see its one-year appreciation (or decline) in this case as being weaker (more negative) than VOO’s expected performance. DBLV is committed to selecting deep value stocks and benchmarks itself to the Russell 1000 Value Index rather than the S&P 500 Index. It has outperformed that benchmark since inception and over the past 12 months, but not over the past three or six months. Its P/E and P/B ratios are the best among the five funds, showing that this is indeed a value equity fund that consistently follows its stated strategy. If you want to supplement the core growth that S&P 500 indexing has provided with a value sleeve, DBLV is a very reasonable choice even taking its somewhat excessive management fee into account.
  3. GURU gets our highest rating of 5. Additionally, our ValuEngine models project GURU to have the best relative performance, virtually flat as compared with -3.3% for the S&P 500. GURU is not actively managed but engineered to mimic the highest conviction holdings of the top tier of star hedge fund managers. The strategy fund has outperformed VOO slightly during the past 5 years but has lagged the benchmark ETF significantly in all the periods since then. It under-performed actively managed TTAC, the upcoming ETF, significantly in every historic period. Mr. Shea’s TTAC has a relatively modest 0.59% expense ratio compared to the 0,75% ratio for GURU, which is high for an indexed strategy fund. All that said, timing is everything and at ValuEngine we are consistent in following our comprehensive modeling methodologies. Therefore, GURU currently gets our strongest recommendation to add for an “alpha sleeve.”
  4. TTAC, gets a HOLD rating of 3, meaning that our models expect it to perform in-line with the S&P 500 Index. That’s fair in the fact that with a Beta of 1.03, it has tracked the index pretty closely. Somewhat surprisingly, it has achieved higher returns than VOO in 4 of the 5 periods measured. Net of fees, TTAC’s returns are still superior to the benchmark ETFs returns. Mr. Shea employs an earnings quality strategy based upon free cash flow along with screens to avoid traps. TTAC is the only active strategy to hold more than 100 stocks. Its volatility is just slightly higher than the index. Its Sharpe Ratio of 1.00, second best to ARKK in this snapshot, indicated that TTAC pays for its slightly above-index volatility with slightly superior returns. So, investors who are uncomfortable having an index managing the entire core holding of their portfolios should take a close look at TTAC as a consistent and affordable actively managed alternative to VOO.
  5. VOO is almost always rated a HOLD at and to perform in line with the market since the S&P 500 Index it follow IS the market or at least a close approximation. Readers of this blog know that fees and structure make SPY an unattractive alternative to VOO as its average annual return is consistently 12 – 14 basis points lower. Investors who are comfortable with indexed cores have been doing very well during the past 12 years. Our models indicate that between 6 and 12 months from now, the market will suffer a minor correction but not a crash. The projected 12-month return for VOO is -3.3%.

What does all of the above mean for investors?

The bottom line is that all of these ETFs are reasonable buys or holds. All three “guru-managed” active funds have done well relative to their benchmarks during most of the periods measured. This is with the provisions that you start DBLV’s performance when DoubleLine took over an under-performing fund and that you measure it against a Value Benchmark index fund rather than the S&P 500 with an understanding that with a six-month exception, value has been out of favor during the past 5 years. I believe both modifications are fair and that DBLV deserves consideration for a value sleeve. ARKK continues to be a strong recommendation for an alpha sleeve even after suffering significantly when its style was out of favor. TrimTabs’ TTAC has been and should continue to be a resilient and affordable actively managed alternative for shifting some core index money into active if desired. GURU gets our strongest recommendations to buy right now and hold for the next twelve months. It is not recommended as a core holding substitute.

Perhaps the biggest takeaway from this analysis is the departure from SPIVA research showing relentless under-performance by the vast majority of active managers including “”gurus.” Admittedly the sample size is small, chiefly because there haven’t been that many well-followed active managers who have shifted to the ETF structure until the 2019 ETF rule came into effect. The bottom line is during most historic periods, TTAC and ARKK outperformed and delivered superior or the same Sharpe Ratios as VOO. DBLV outperformed its Russell 1000 Value ETF as well. As for beating the market by using the highest conviction hedge fund holding using a strategy index, that worked well for GURU in 2017 and 2018 but not so well after that. Earlier I referred to my ValuEngine article (link at beginning of this post) on how the more efficient ETF structure levels the playing field for active managers. I urge you to download it and understand the differences for yourself. One game-changer that has added power to the new wave of actively managed ETFs is the fact that it is now possible to disguise trades by using semi-transparent basket tools such as “Shielded Alpha” from the Blue Tractor group.

This was a small sample size but provides evidence behind my research that moving to the ETF structure does indeed level the playing field vs. benchmark ETFs – especially ETFs with well-known managers sticking to their tried-and-true strategic disciplines.